

Volatility is one risk we cannot escape from when deploying our savings into the capital markets. And that’s a risk we have learned to accept because barring the stupid us and our behavior, the probability of messing up our finances with a decently diversified portfolio over a long-term is virtually nil.
So that’s that but the other big risk of course is the probability of outliving our savings. And volatility is one reason we tune our portfolios depending upon when, how much and for how long we are going to draw income from our savings.
But what could really throw a monkey-wrench into all our planning is the pattern associated with that volatility. Are the ups and downs of our portfolios random or is there an inherent pattern to how those returns transpire? Peter L. Bernstein in his book ‘Against The Gods: The Remarkable Story of Risk‘ hints at caution against over-reliance on historical data for just this reason.
So we pour in data from the past to fuel the decision-making mechanisms created by our models, be they linear or nonlinear. But therein lies the logician’s trap: past data from real life constitute a sequence of events rather than a set of independent observations, which is what the laws of probability demand. Even though many economic and financial variables fall into distributions that approximate a bell curve, the picture is never perfect. It is in those outliers and imperfections that the wildness lurks.
That is that even if you were able to extract the key statistical measures from past data, you don’t want to just go on and use them to predict what future returns will amount to. That’s because without taking into consideration the current market environment and those outlier events, you could be way off from what you planned.
And the sequence of how those portfolio returns come about during retirement could be one of those outlier events that determines whether you depart with millions left behind or your money departs way before you depart. The technical term for this and as implied is the sequence of returns risk. That’s one more risk we need to plan for and to understand its implication, we’ll walk through just what could go wrong even when we have done everything right.
So even though an over-reliance on past data could lead us astray with our plans, we still need some basic metrics to anticipate what future returns could look like. So we do just that and use historical performance data for both stocks and bonds in some combination of each in a given portfolio to simulate those outlier scenarios. We first fit a simulated distribution (in yellow) of returns for stocks over a distribution of the actual past returns (in pink) as shown below to see if a bell-shaped distribution of returns assumption holds.
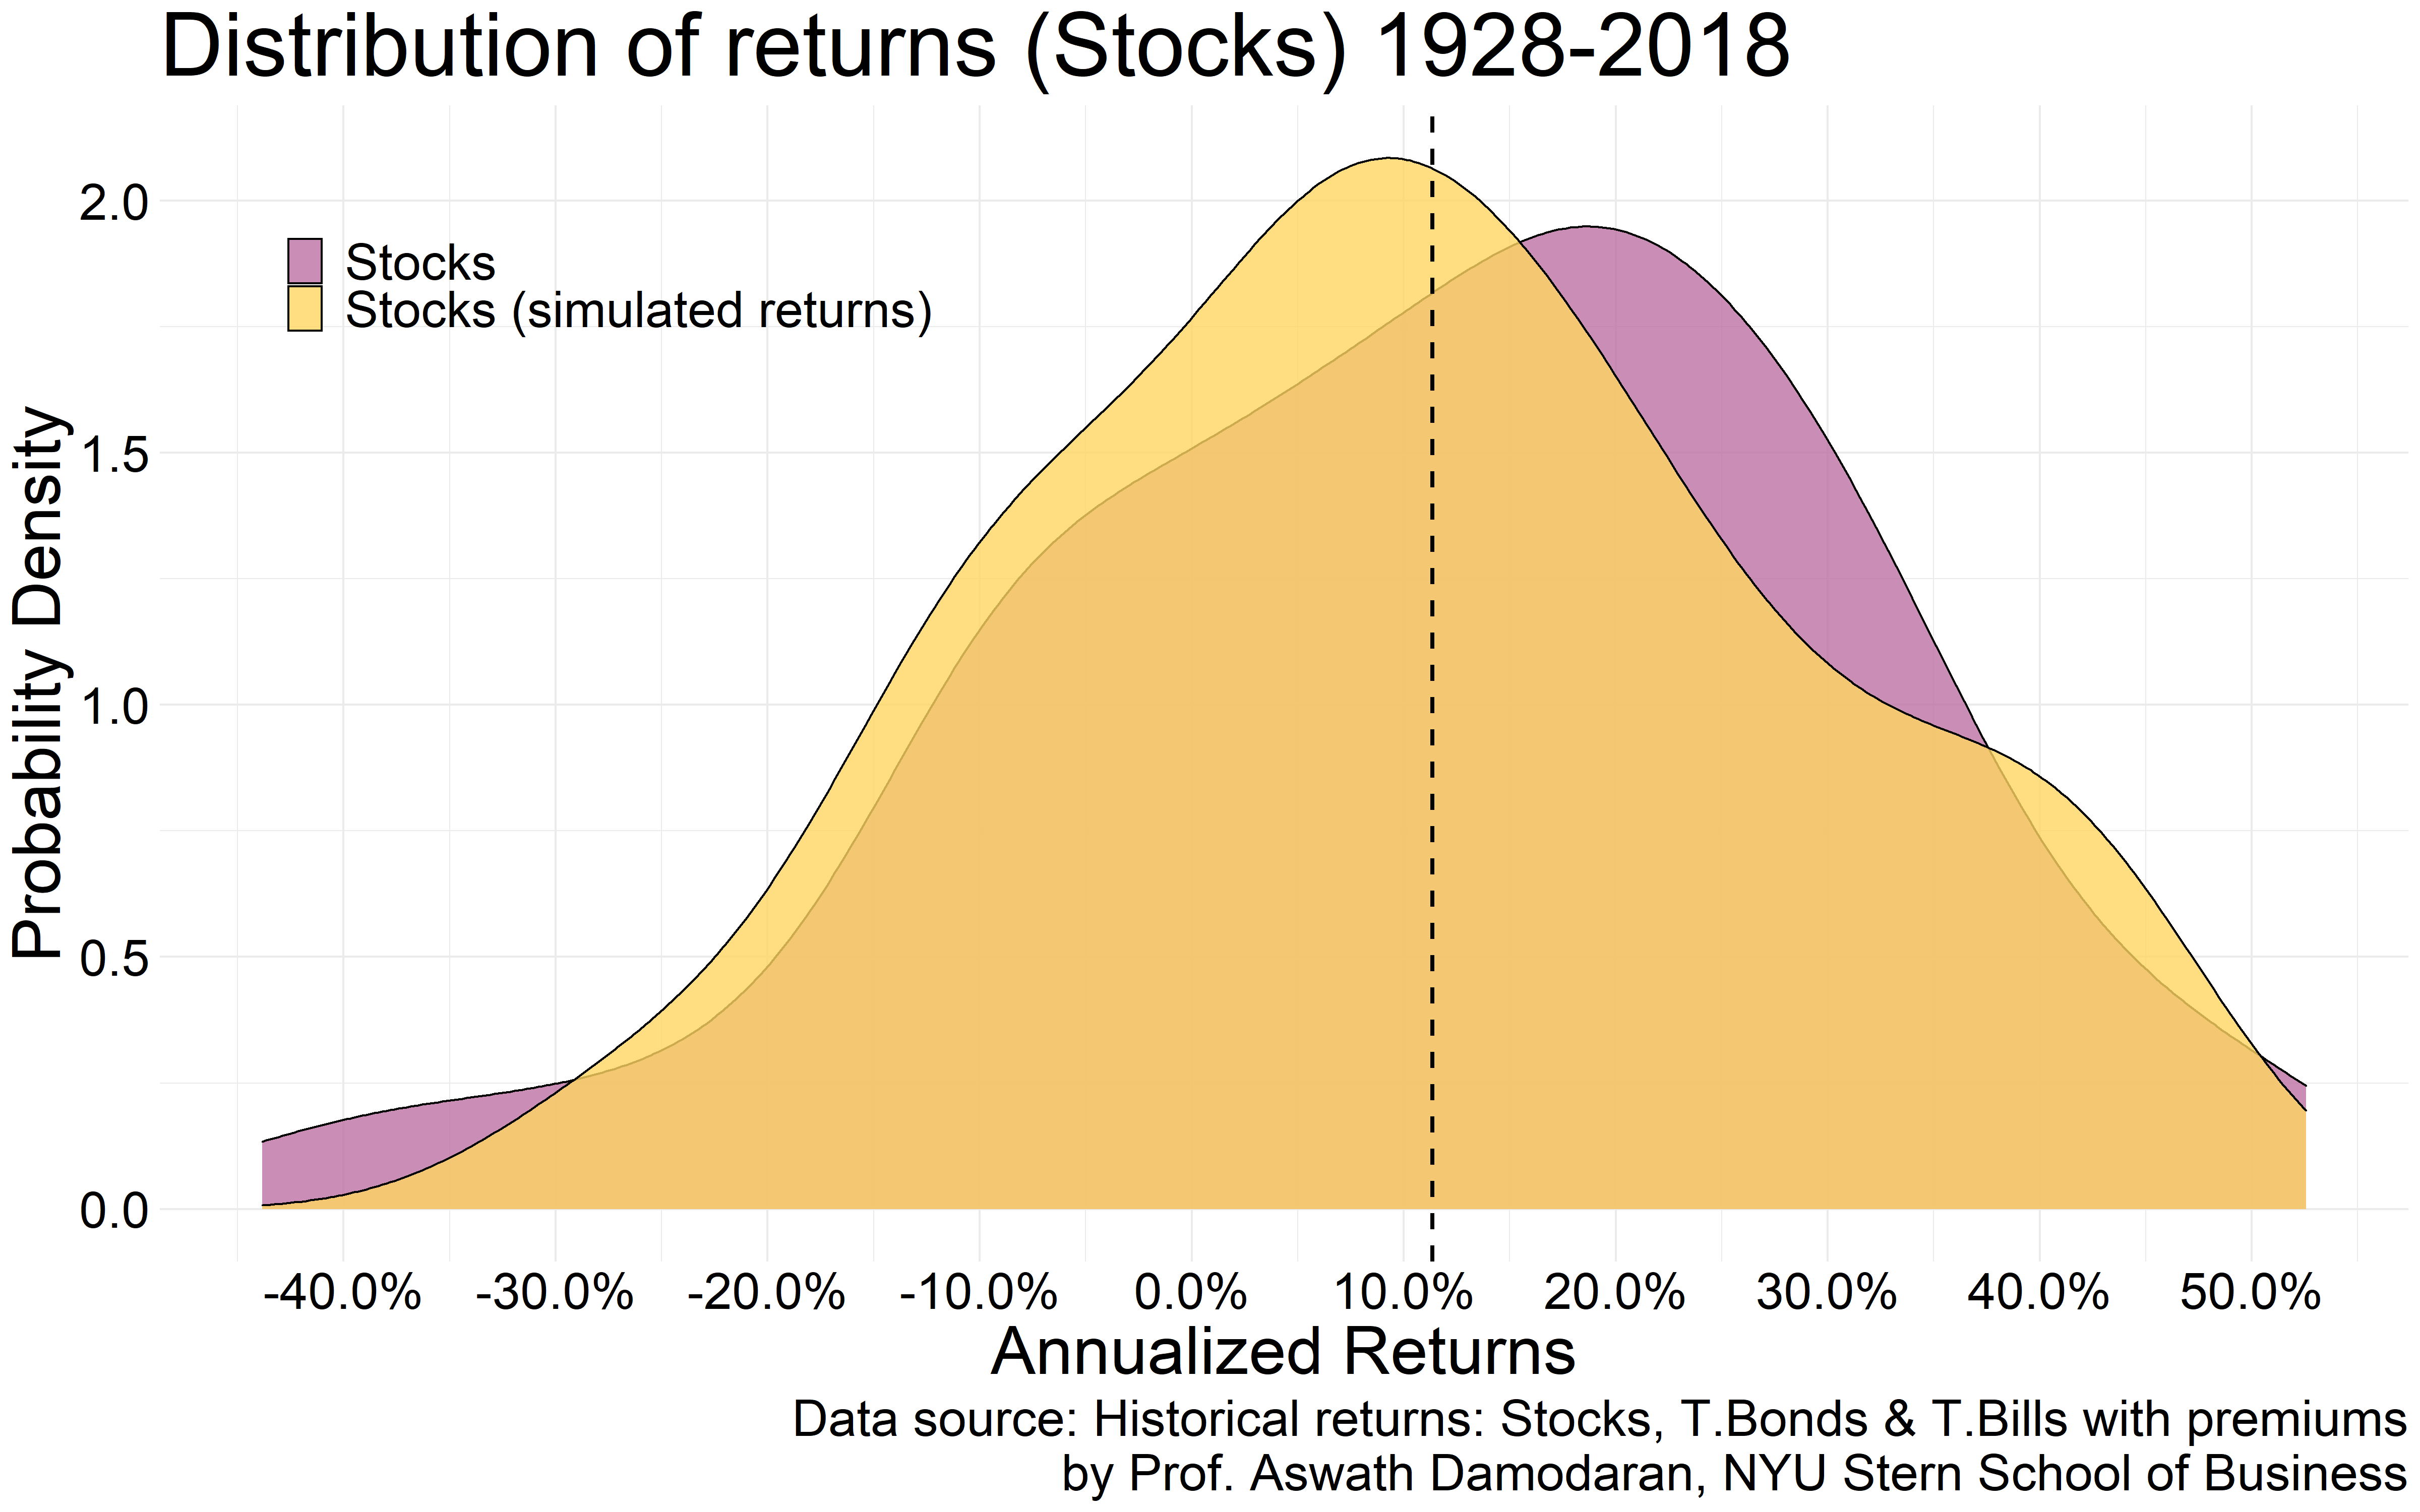
It does to some extent for this one sample so we go with this assumption and extract the mean (average) and the volatility (standard deviation) associated with that distribution as a baseline to help predict future returns. The average historical return for stocks by the way is the black, dashed line which shows that stocks on average have returned around 10% annually during this entire time-frame.
We do the same for bonds and extract the relevant parameters to help us with predicting future returns. The average actual historical return for bonds is shown by the black, dashed line below.
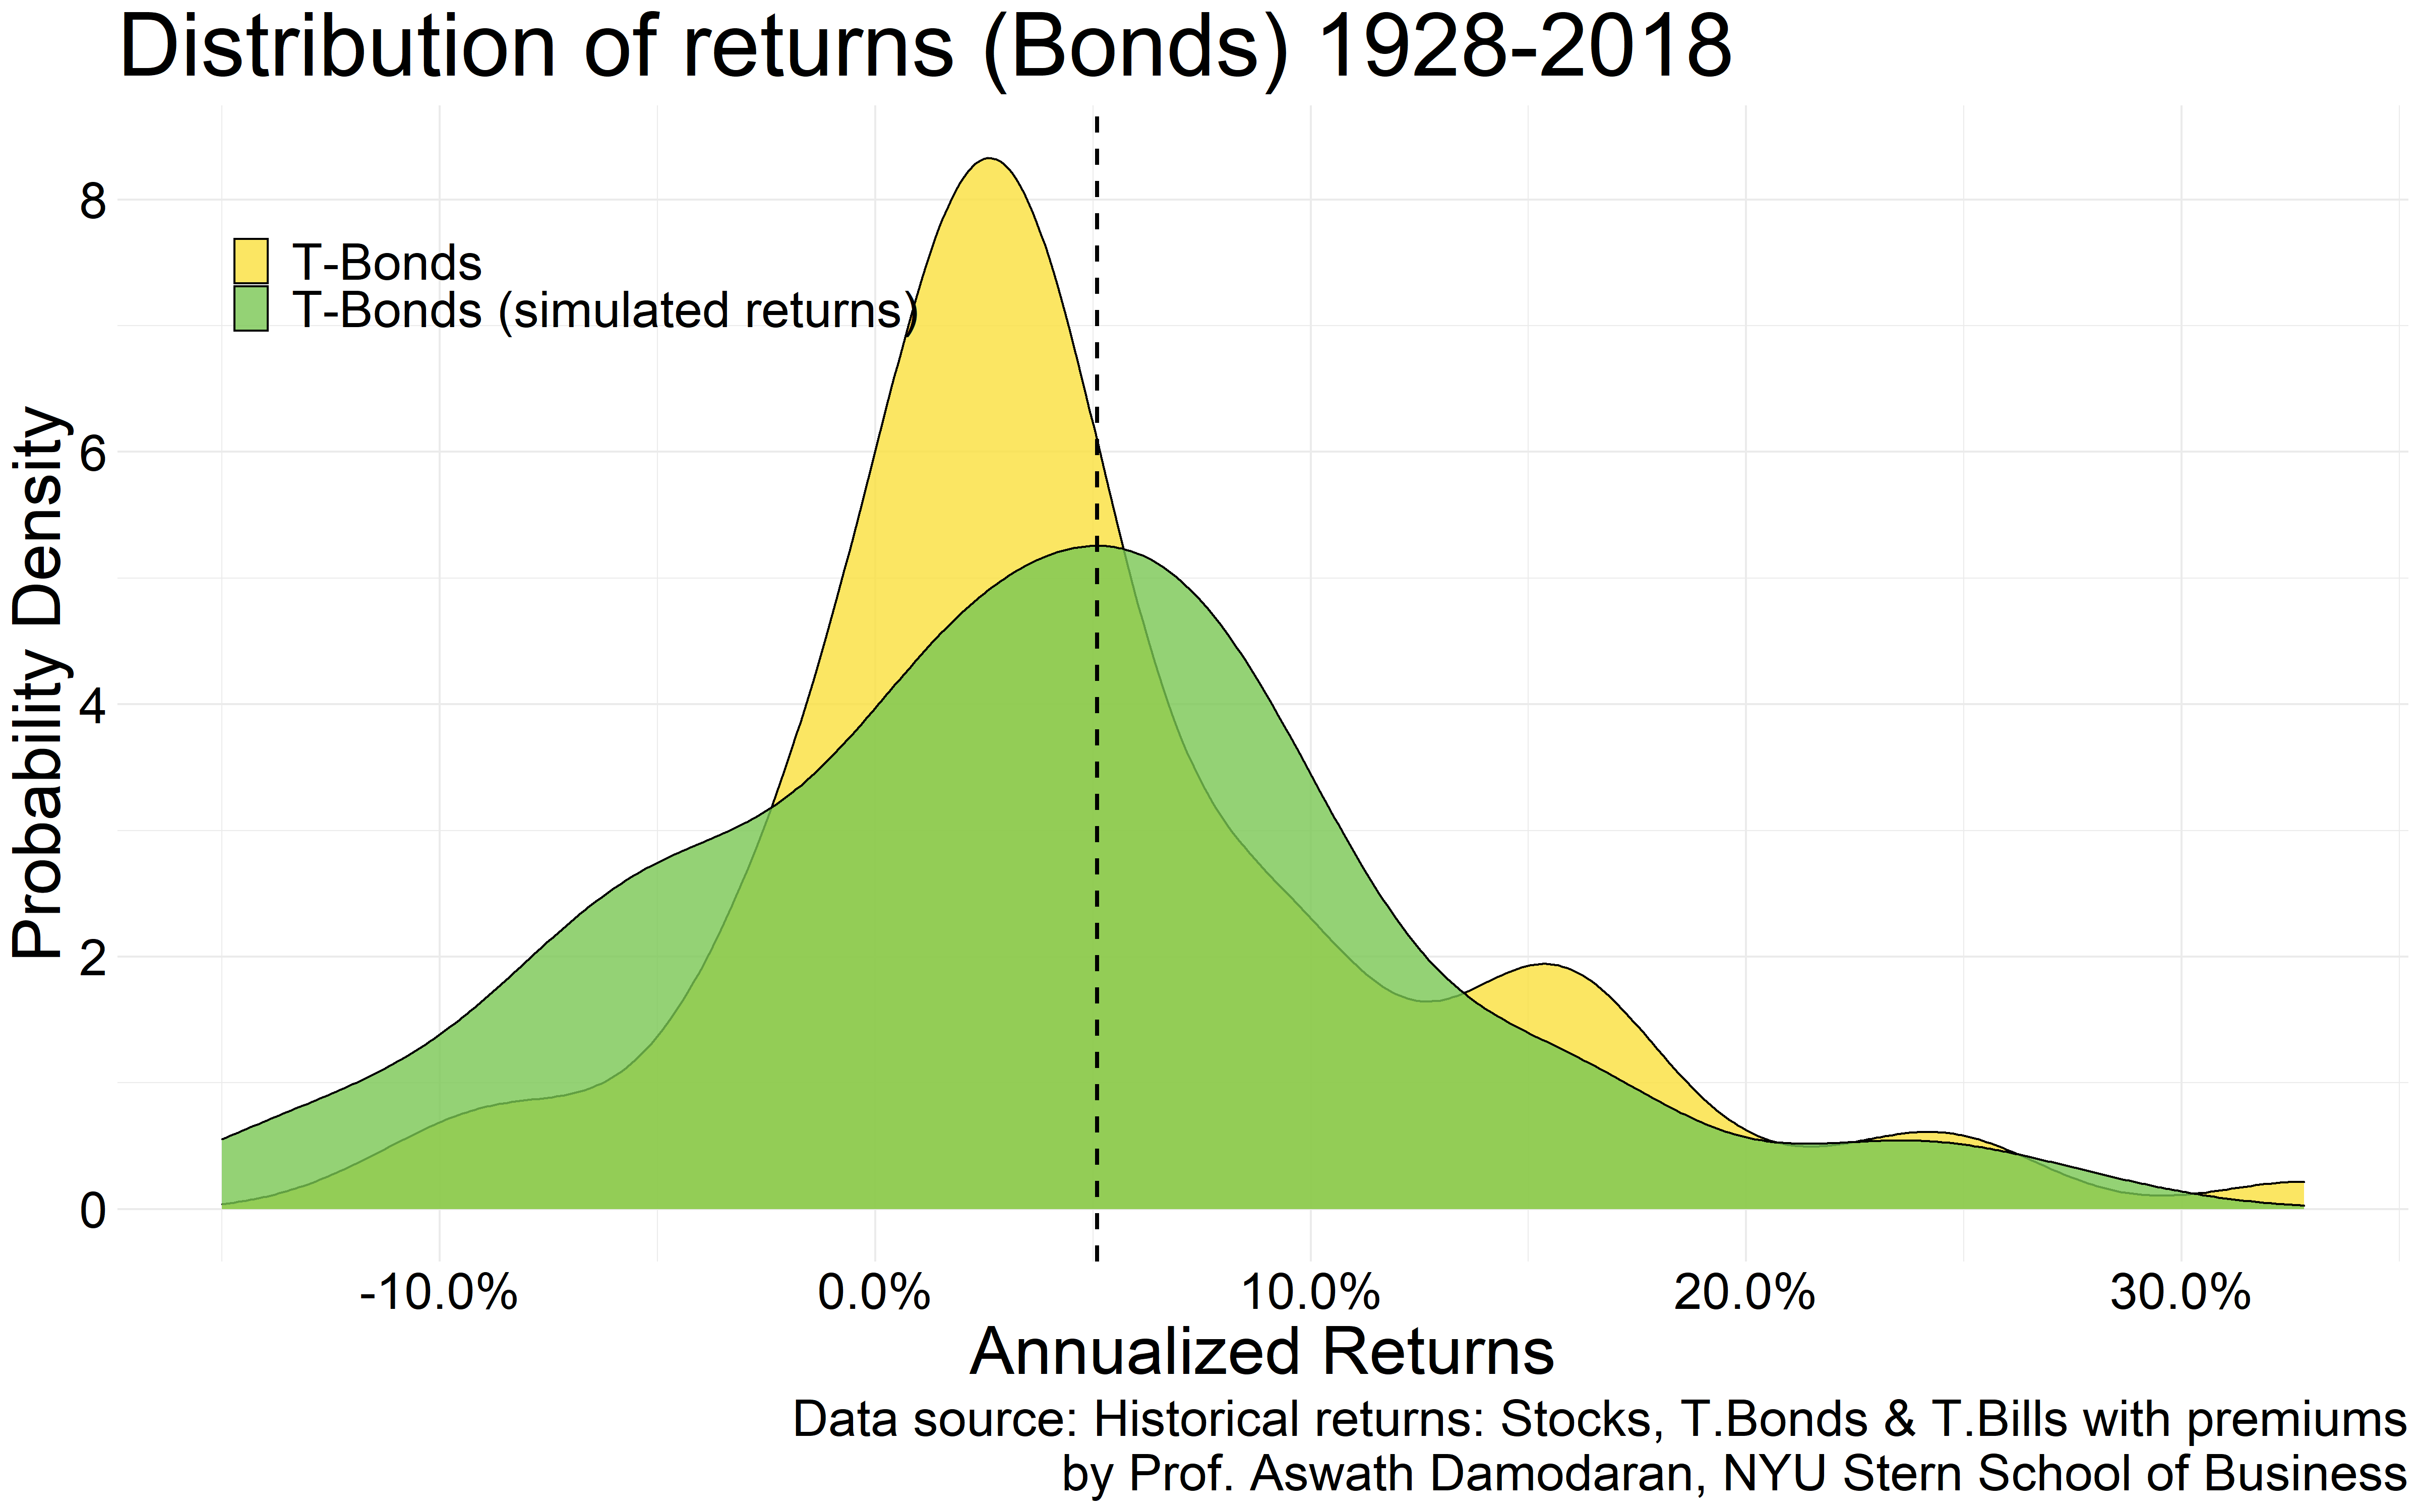
Before I get arrested for committing more statistical crimes, if you were to retire today, expecting anything more than 3% in annual returns from a Treasury bond portfolio is outright lunacy. And hence even if the average return for bonds in the past was 5%, we’ll use a static 3% for the bond component of our portfolios during retirement. And while we are at it, we’ll also apply a 30% haircut to the average predicted return for stocks during retirement while preserving the same volatility estimate as in the past.
Why do that? For bonds, it’s clear. Just look at where interest rates are today.
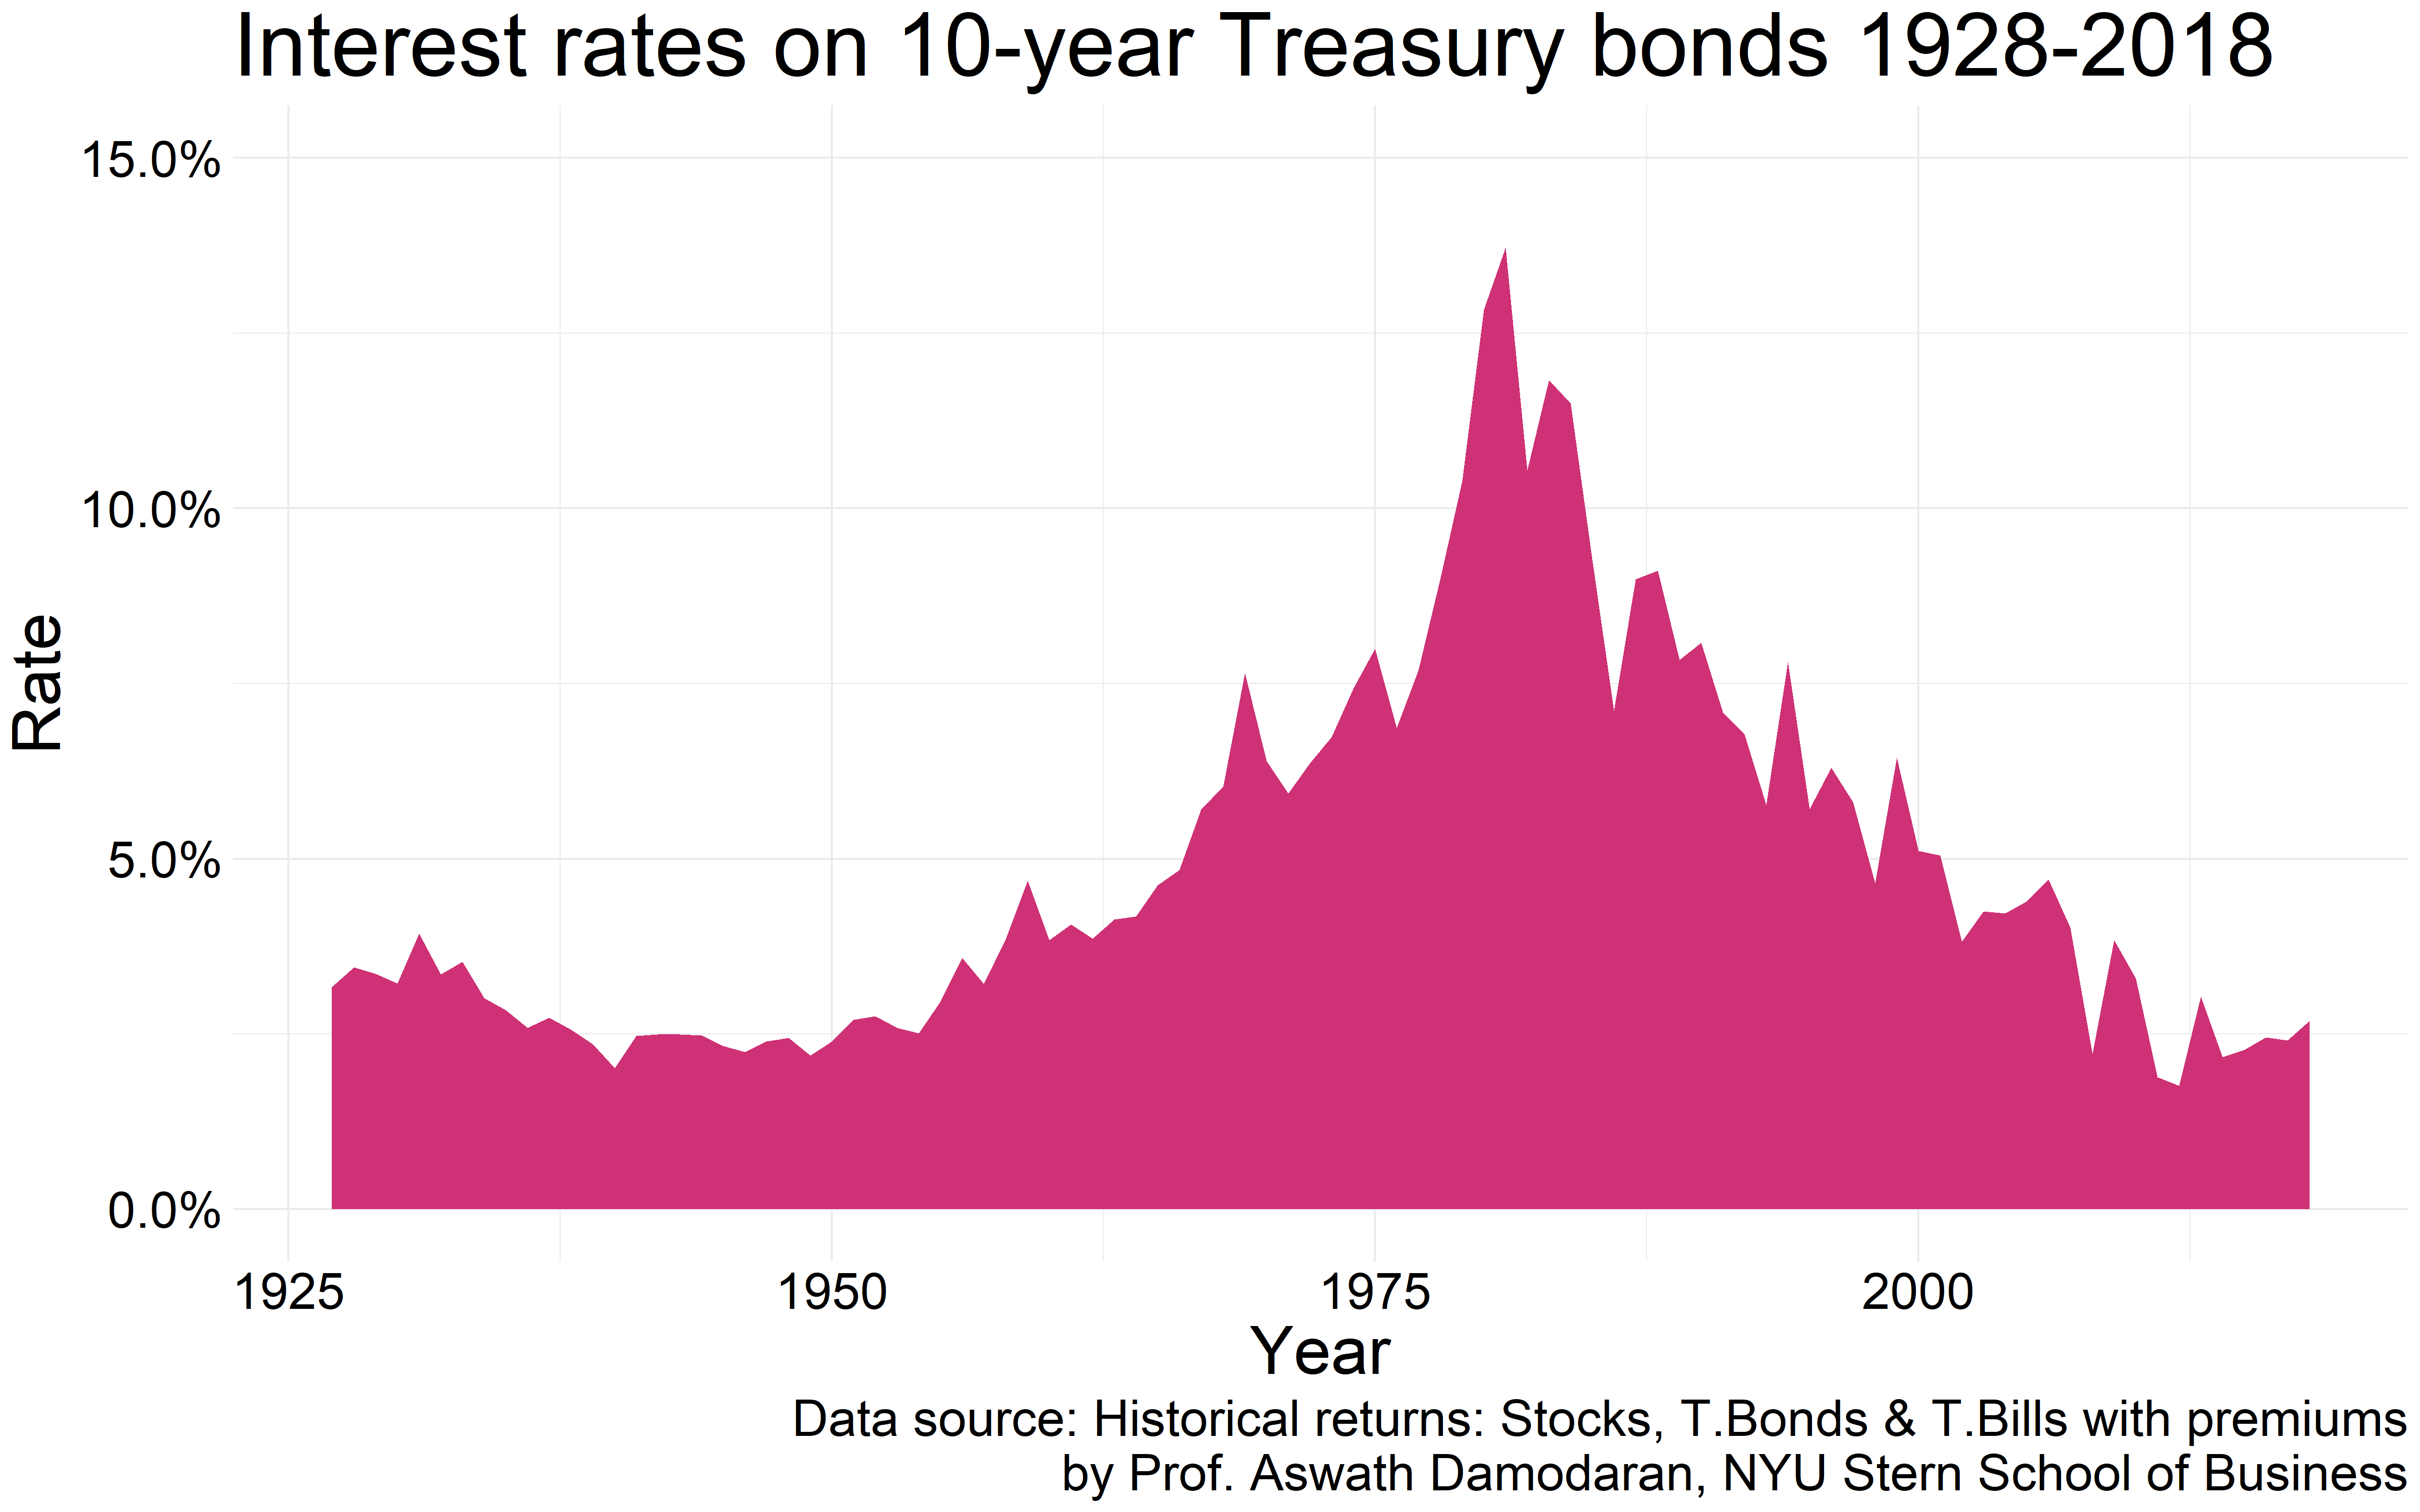
What we can reasonably expect out in the future is either rates remaining the same or rising.
And we know what a rising rate environment does to the price of bonds and hence the 3% total return assumption for the bond component of our portfolios.
Paying interest on bonds (issuing debt to finance operations) is a cost to businesses and a rising rate environment means that the cost to service that debt will rise as well. That implies a decline in profitability for businesses that rely on debt financing and that along with where the stock market valuations are today means a 30% haircut on future stock market returns assumption is quite reasonable.
Using these corrected return estimates and past volatility measures, we predict what future stock market returns could look like.
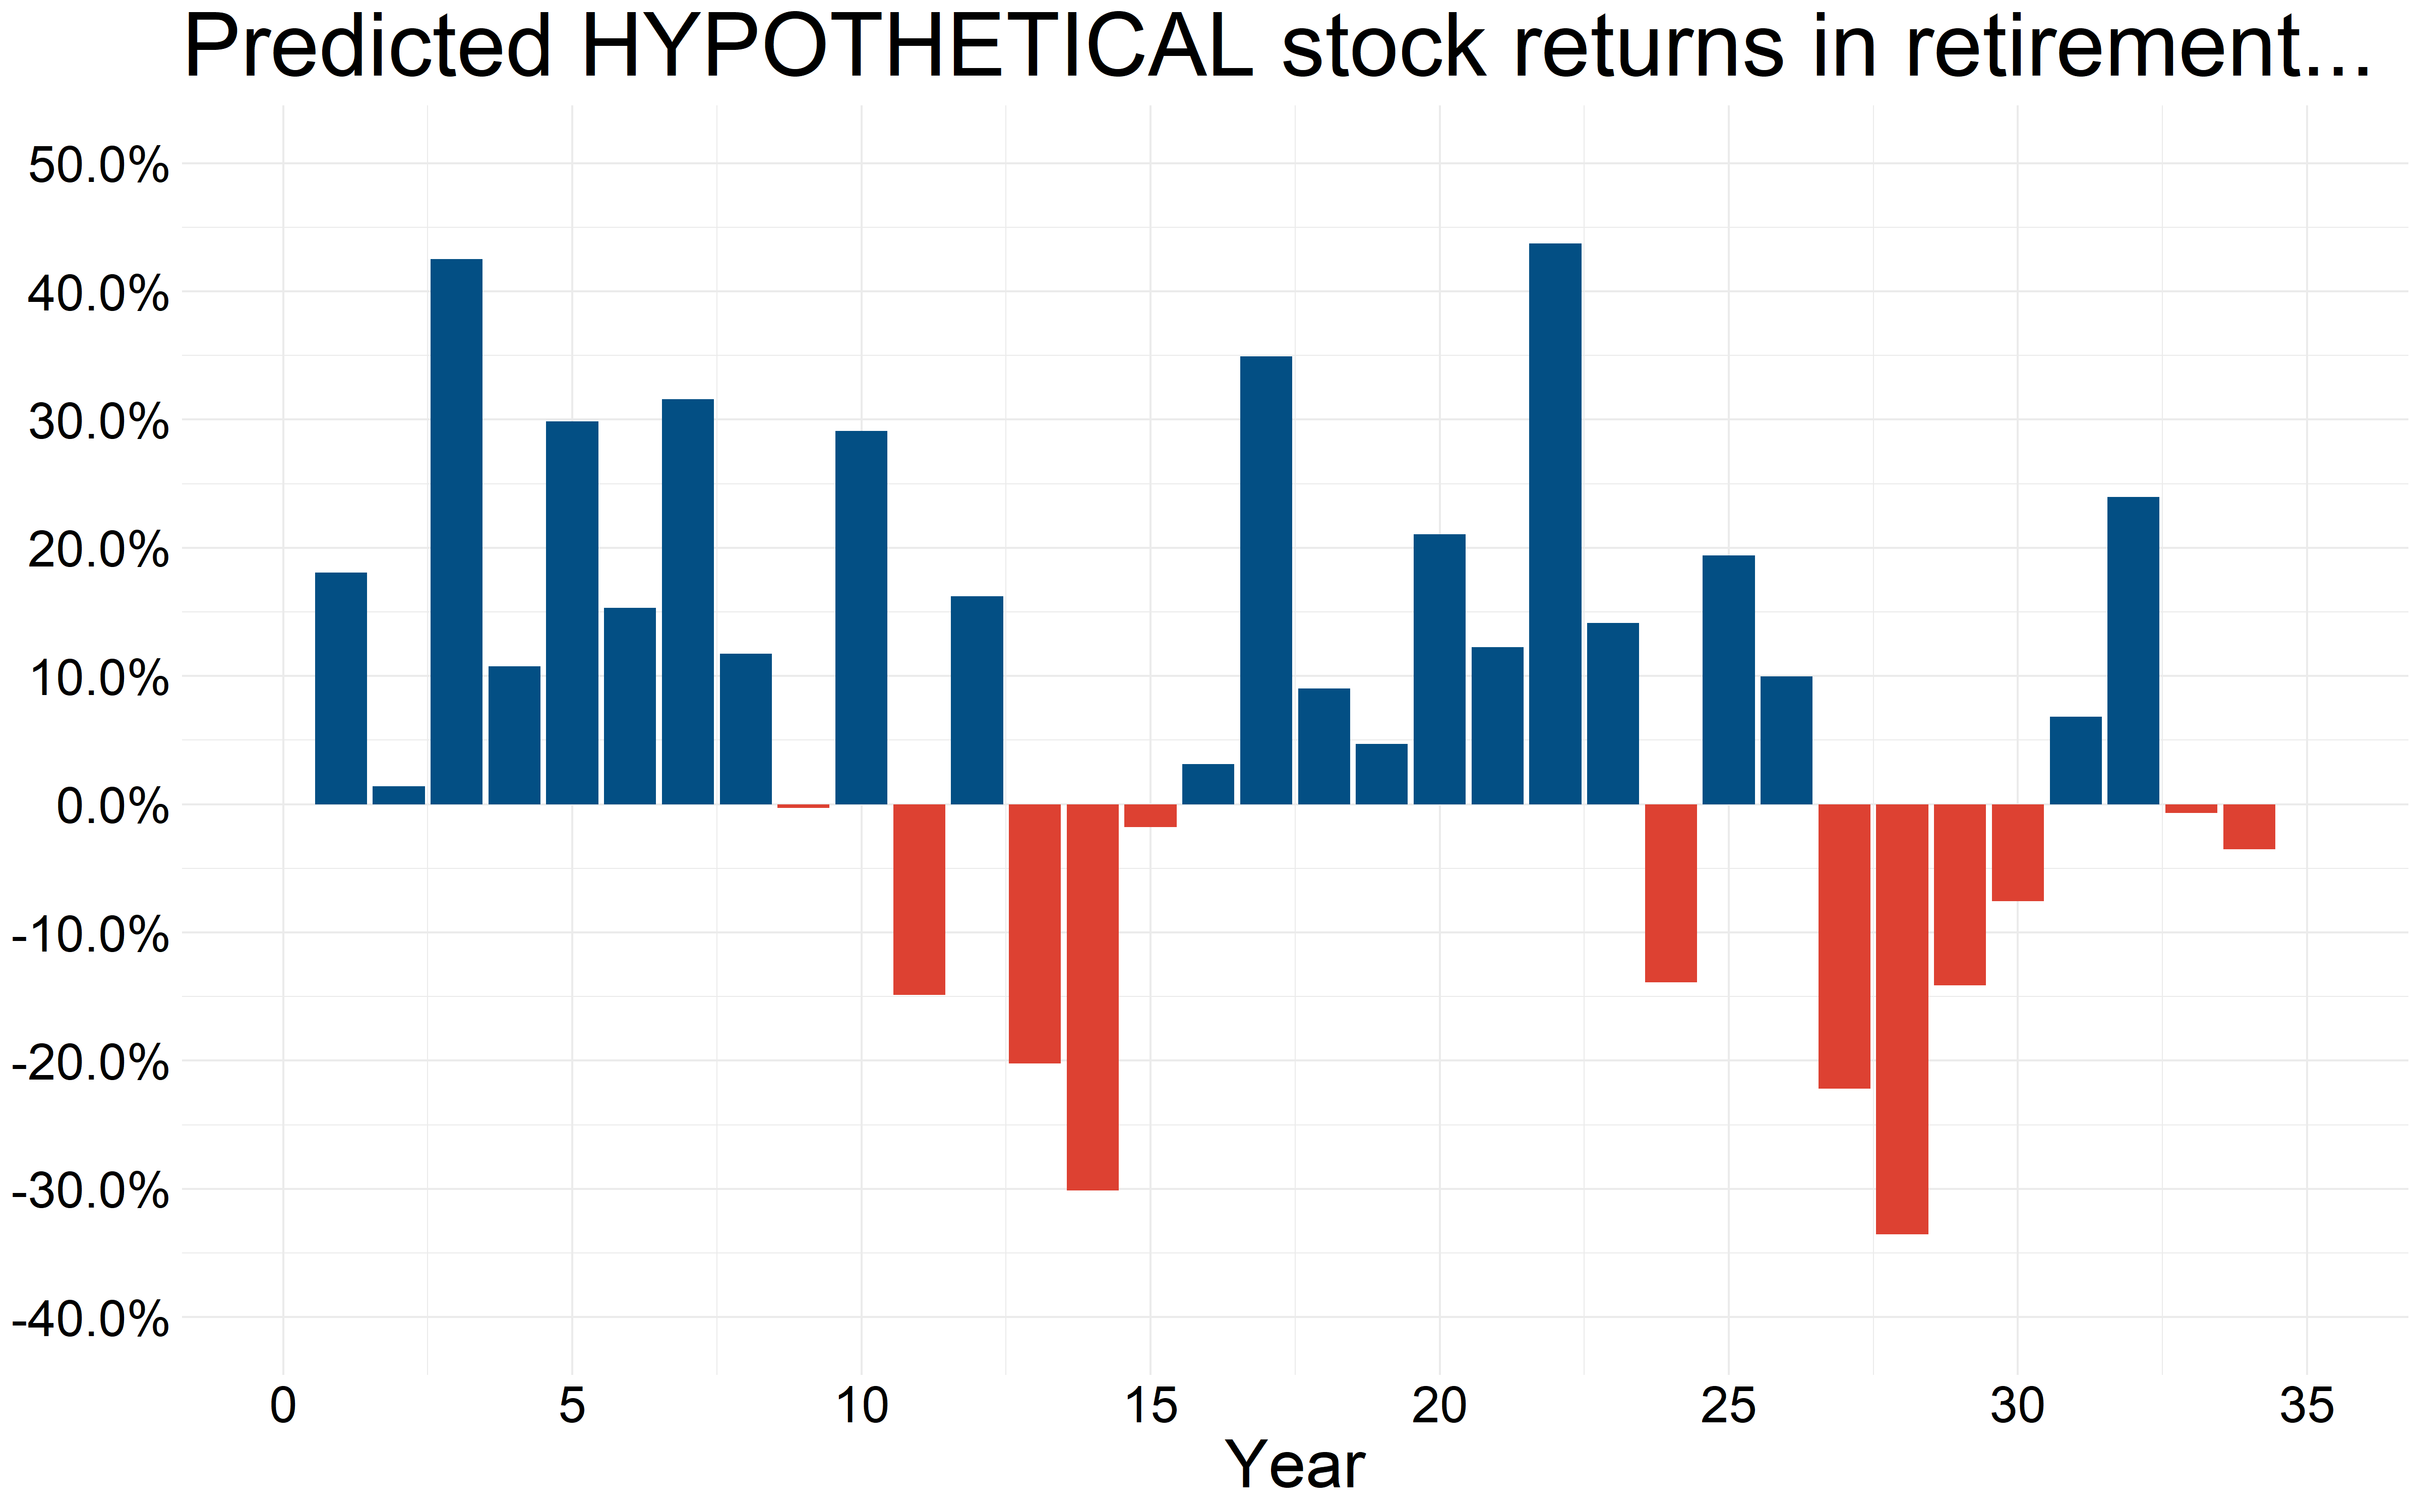
That intermittently random pattern of returns is what we could typically expect though this is just one sample. But what if the sequence of stock market returns of the future follow this pattern?
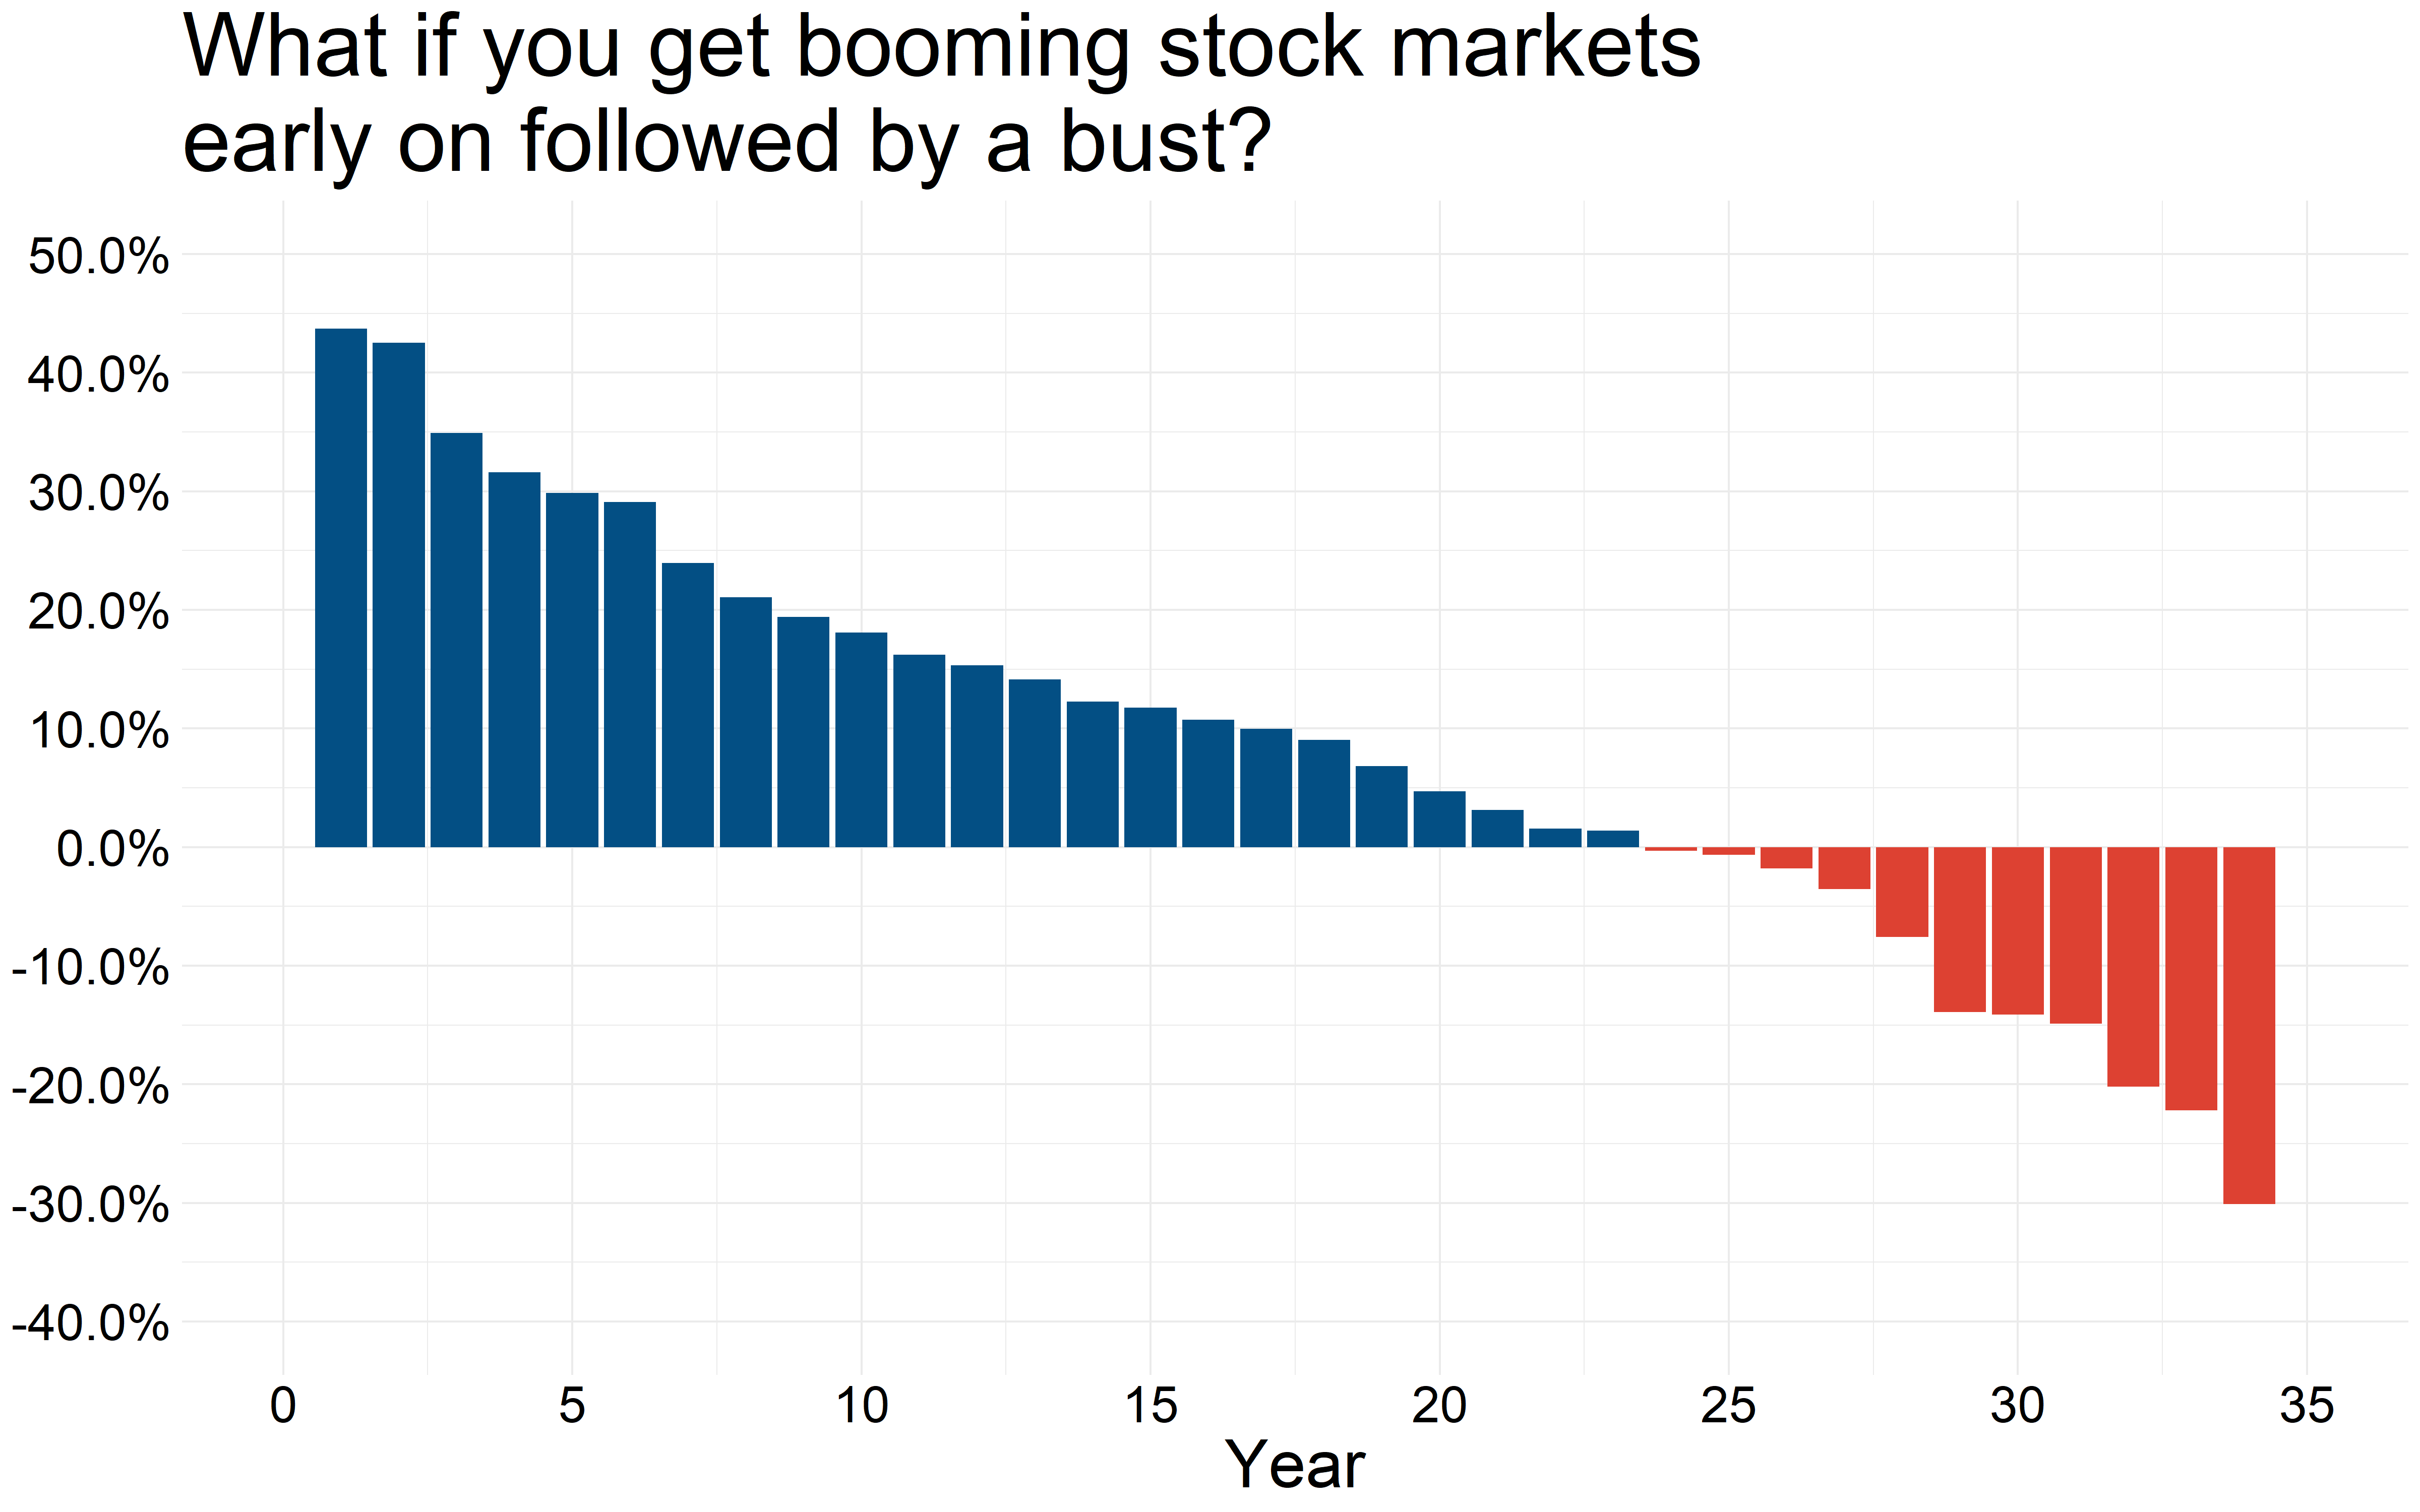
Or this?
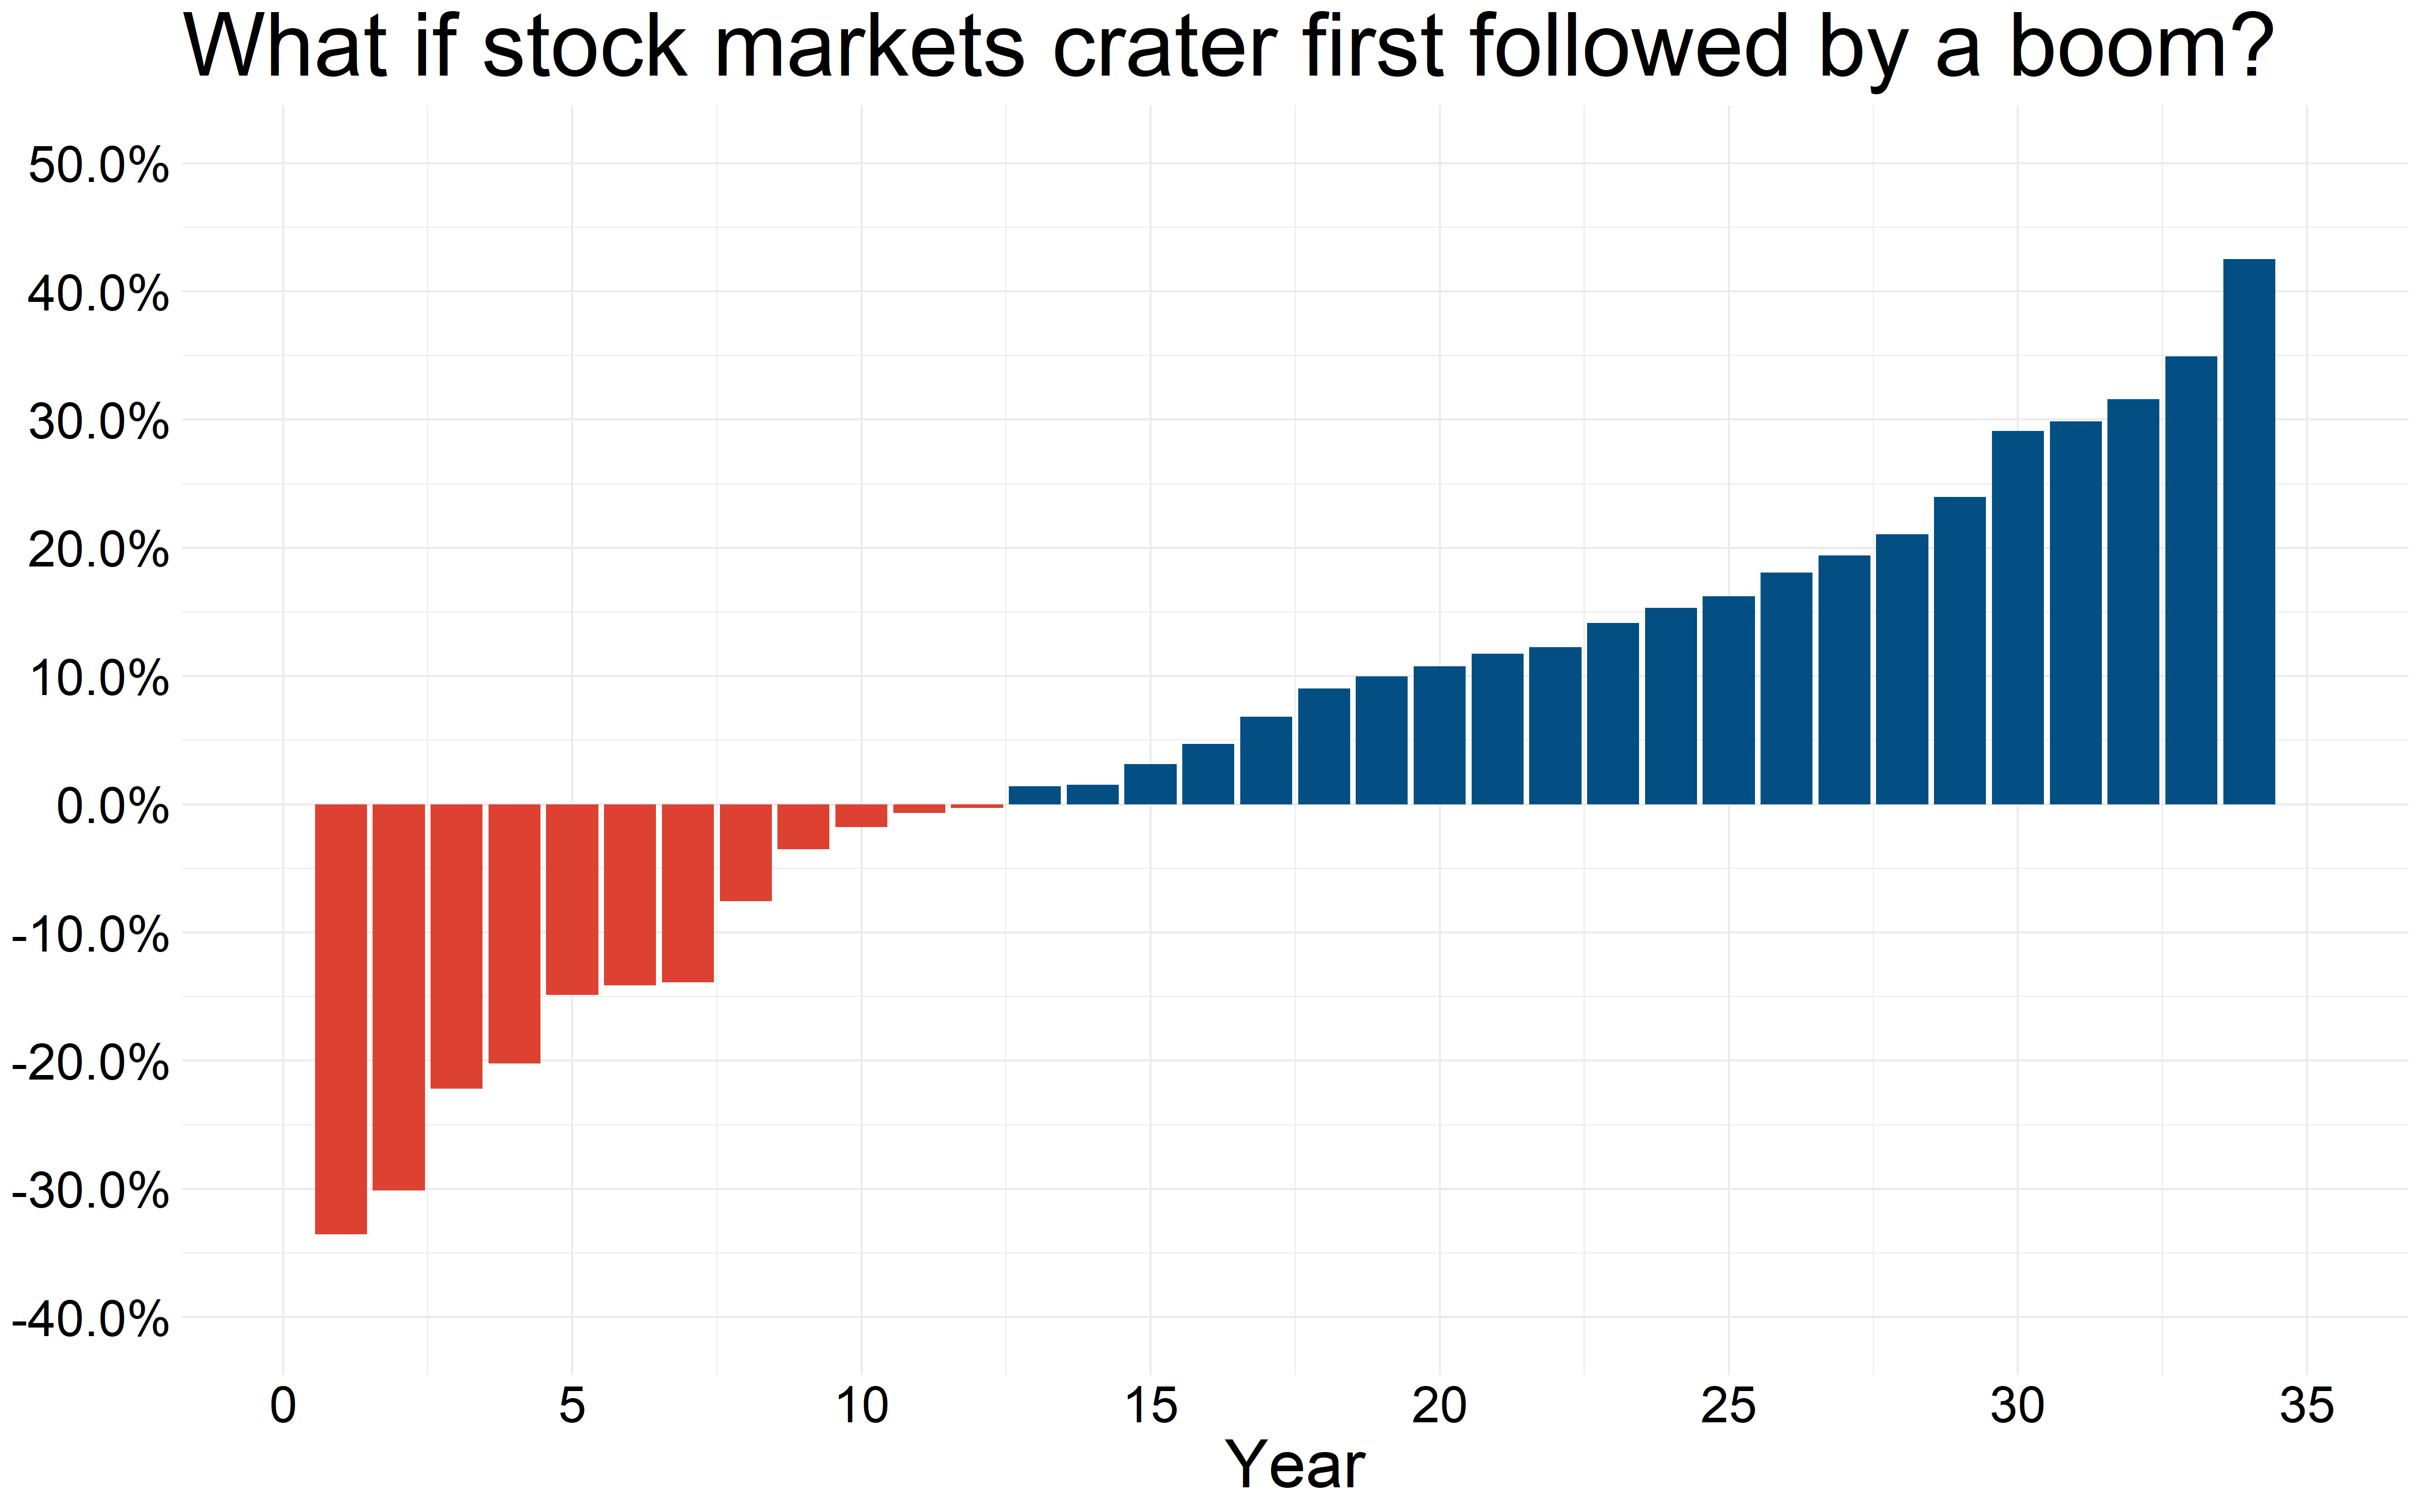
Shown below is what a $1.25 million portfolio invested in a 60/40 stock/bond mix that is re-balanced annually grows to during 35 years in retirement for the three patterns of stock market returns described above. Remember that the bond component is assumed to yield a static 3% during this entire time-frame.
Why start out with a $1.25 million portfolio? That’s because this number assumes a $50,000 inflation-adjusted income draw for each year in retirement and the so-called 4% rule for withdrawal rate at the start gets us to a portfolio size of $1.25 million.
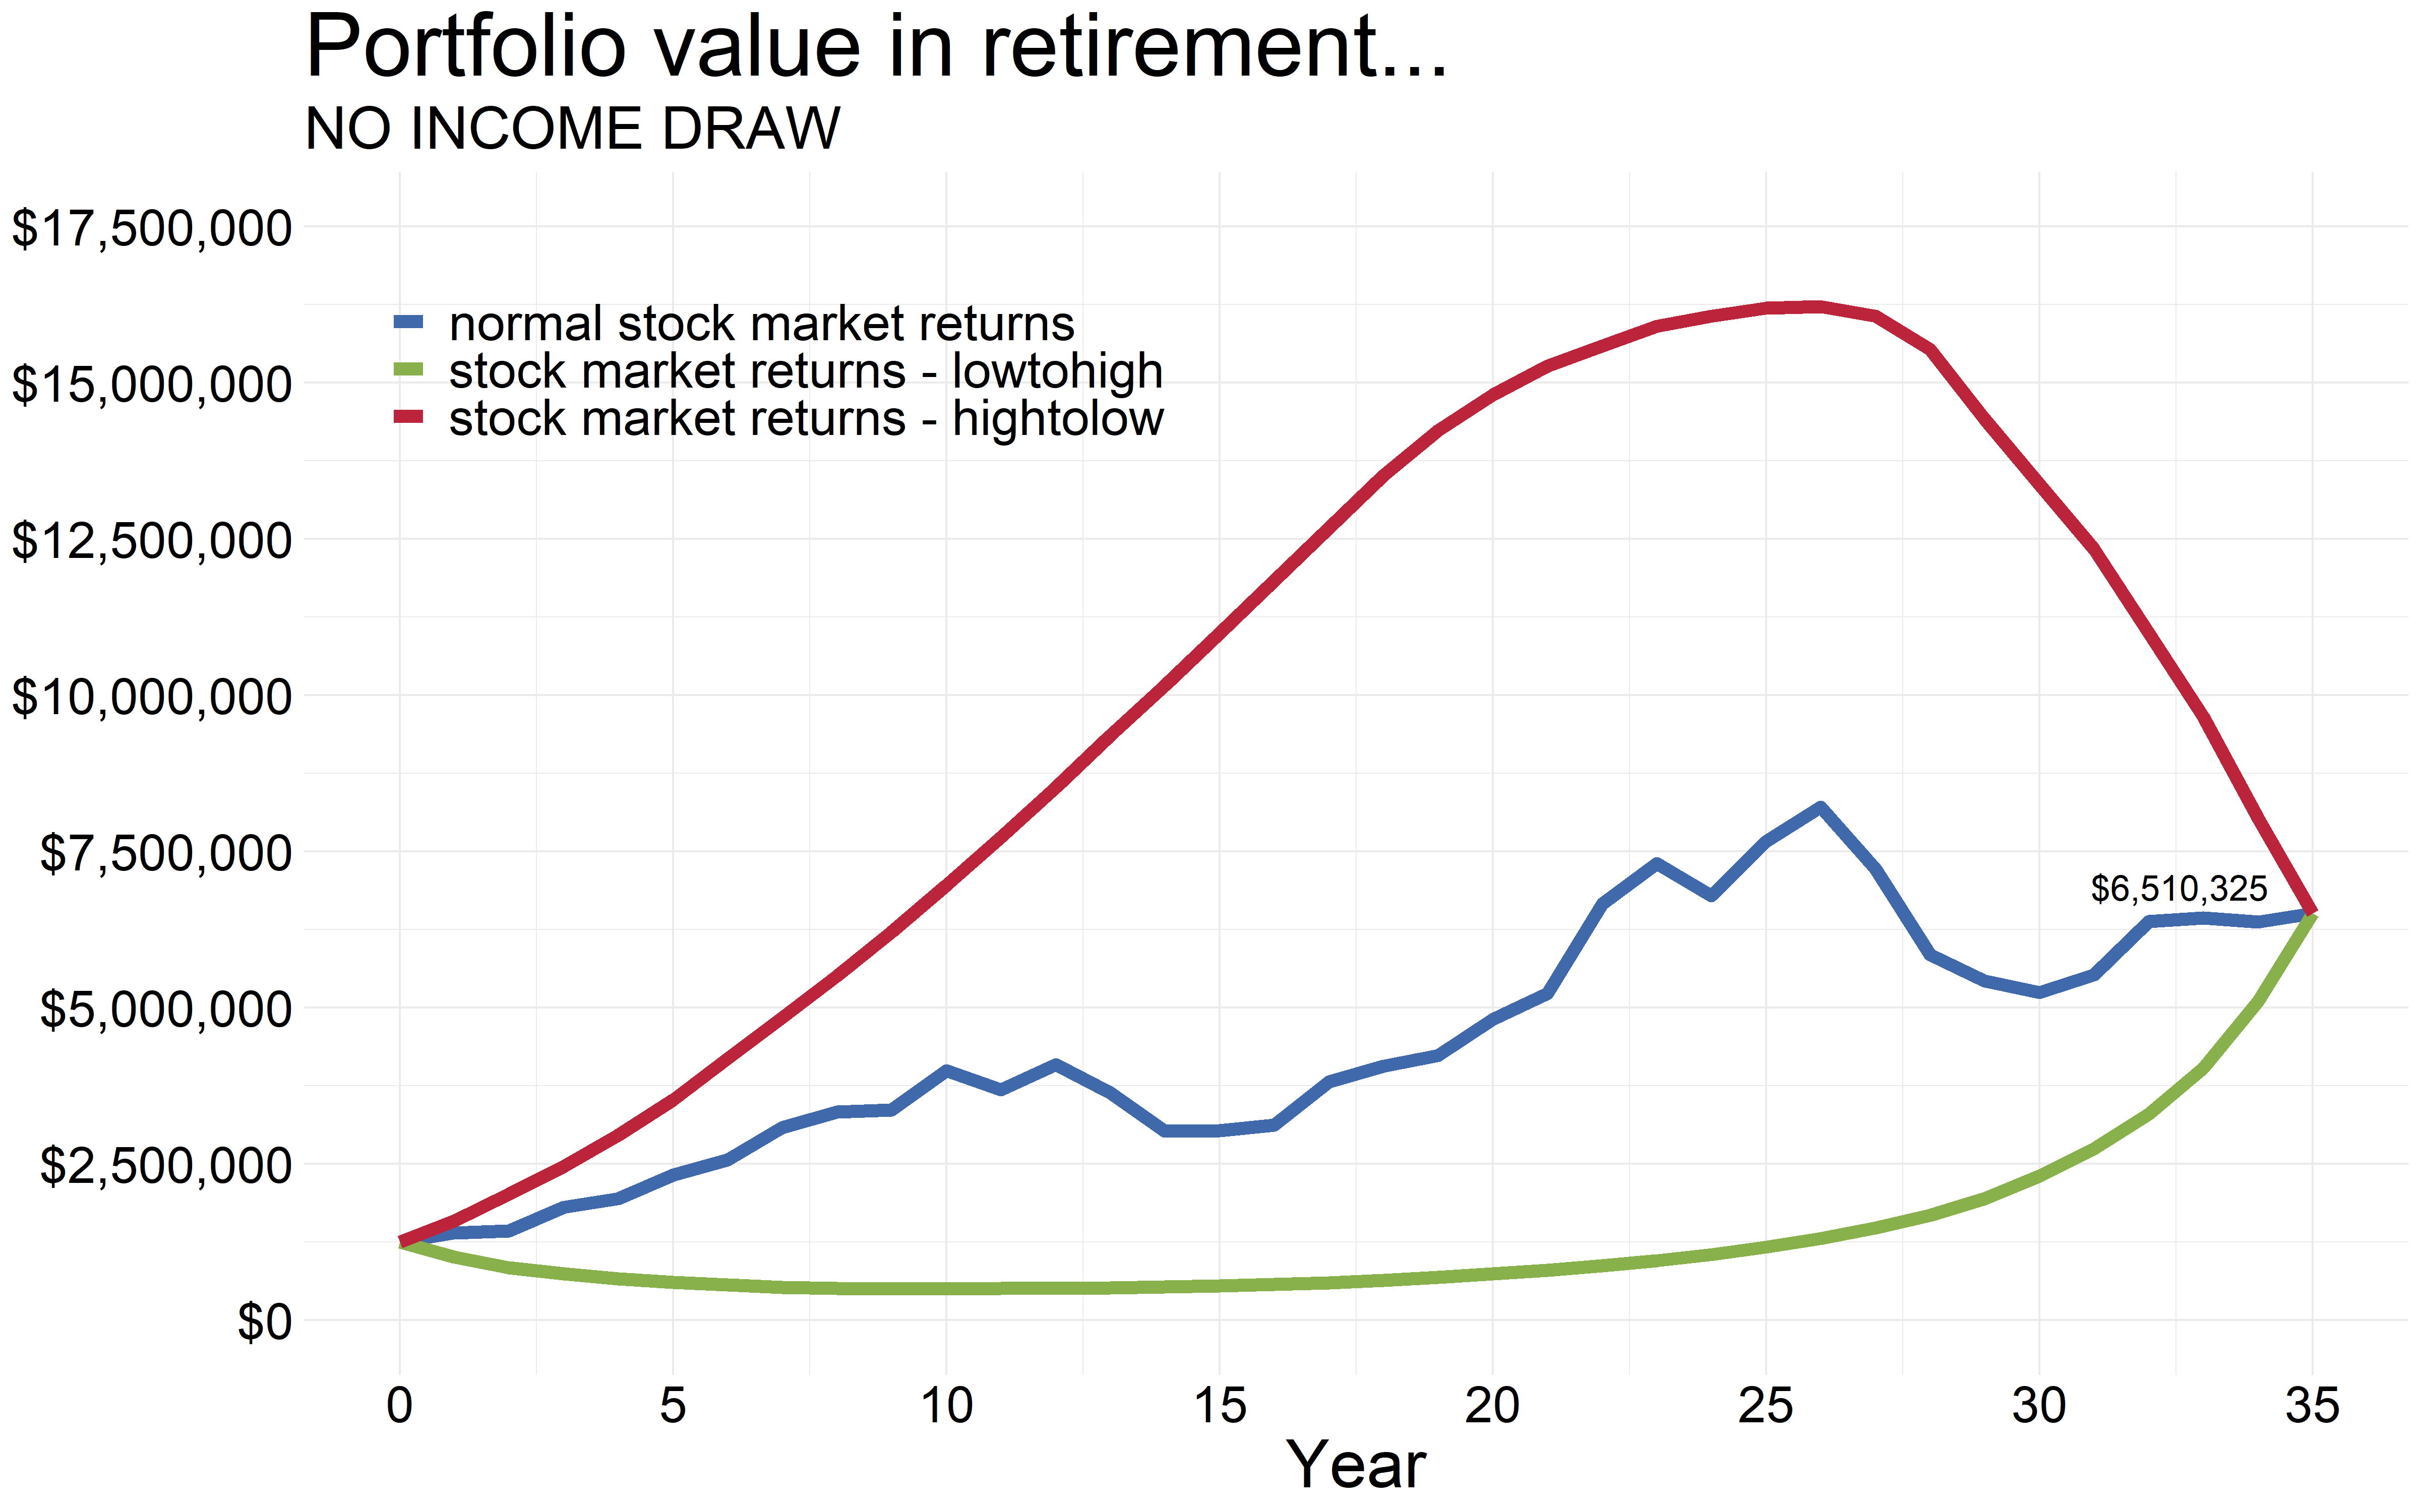
So regardless of the sequence of returns, the final value of the portfolio is the same. And that’s because we are not drawing income from this portfolio yet and hence is left to compound for all those years in retirement.
But this is what happens if we were to draw a 4% annual inflation-adjusted income stream off of the starting portfolio balance.
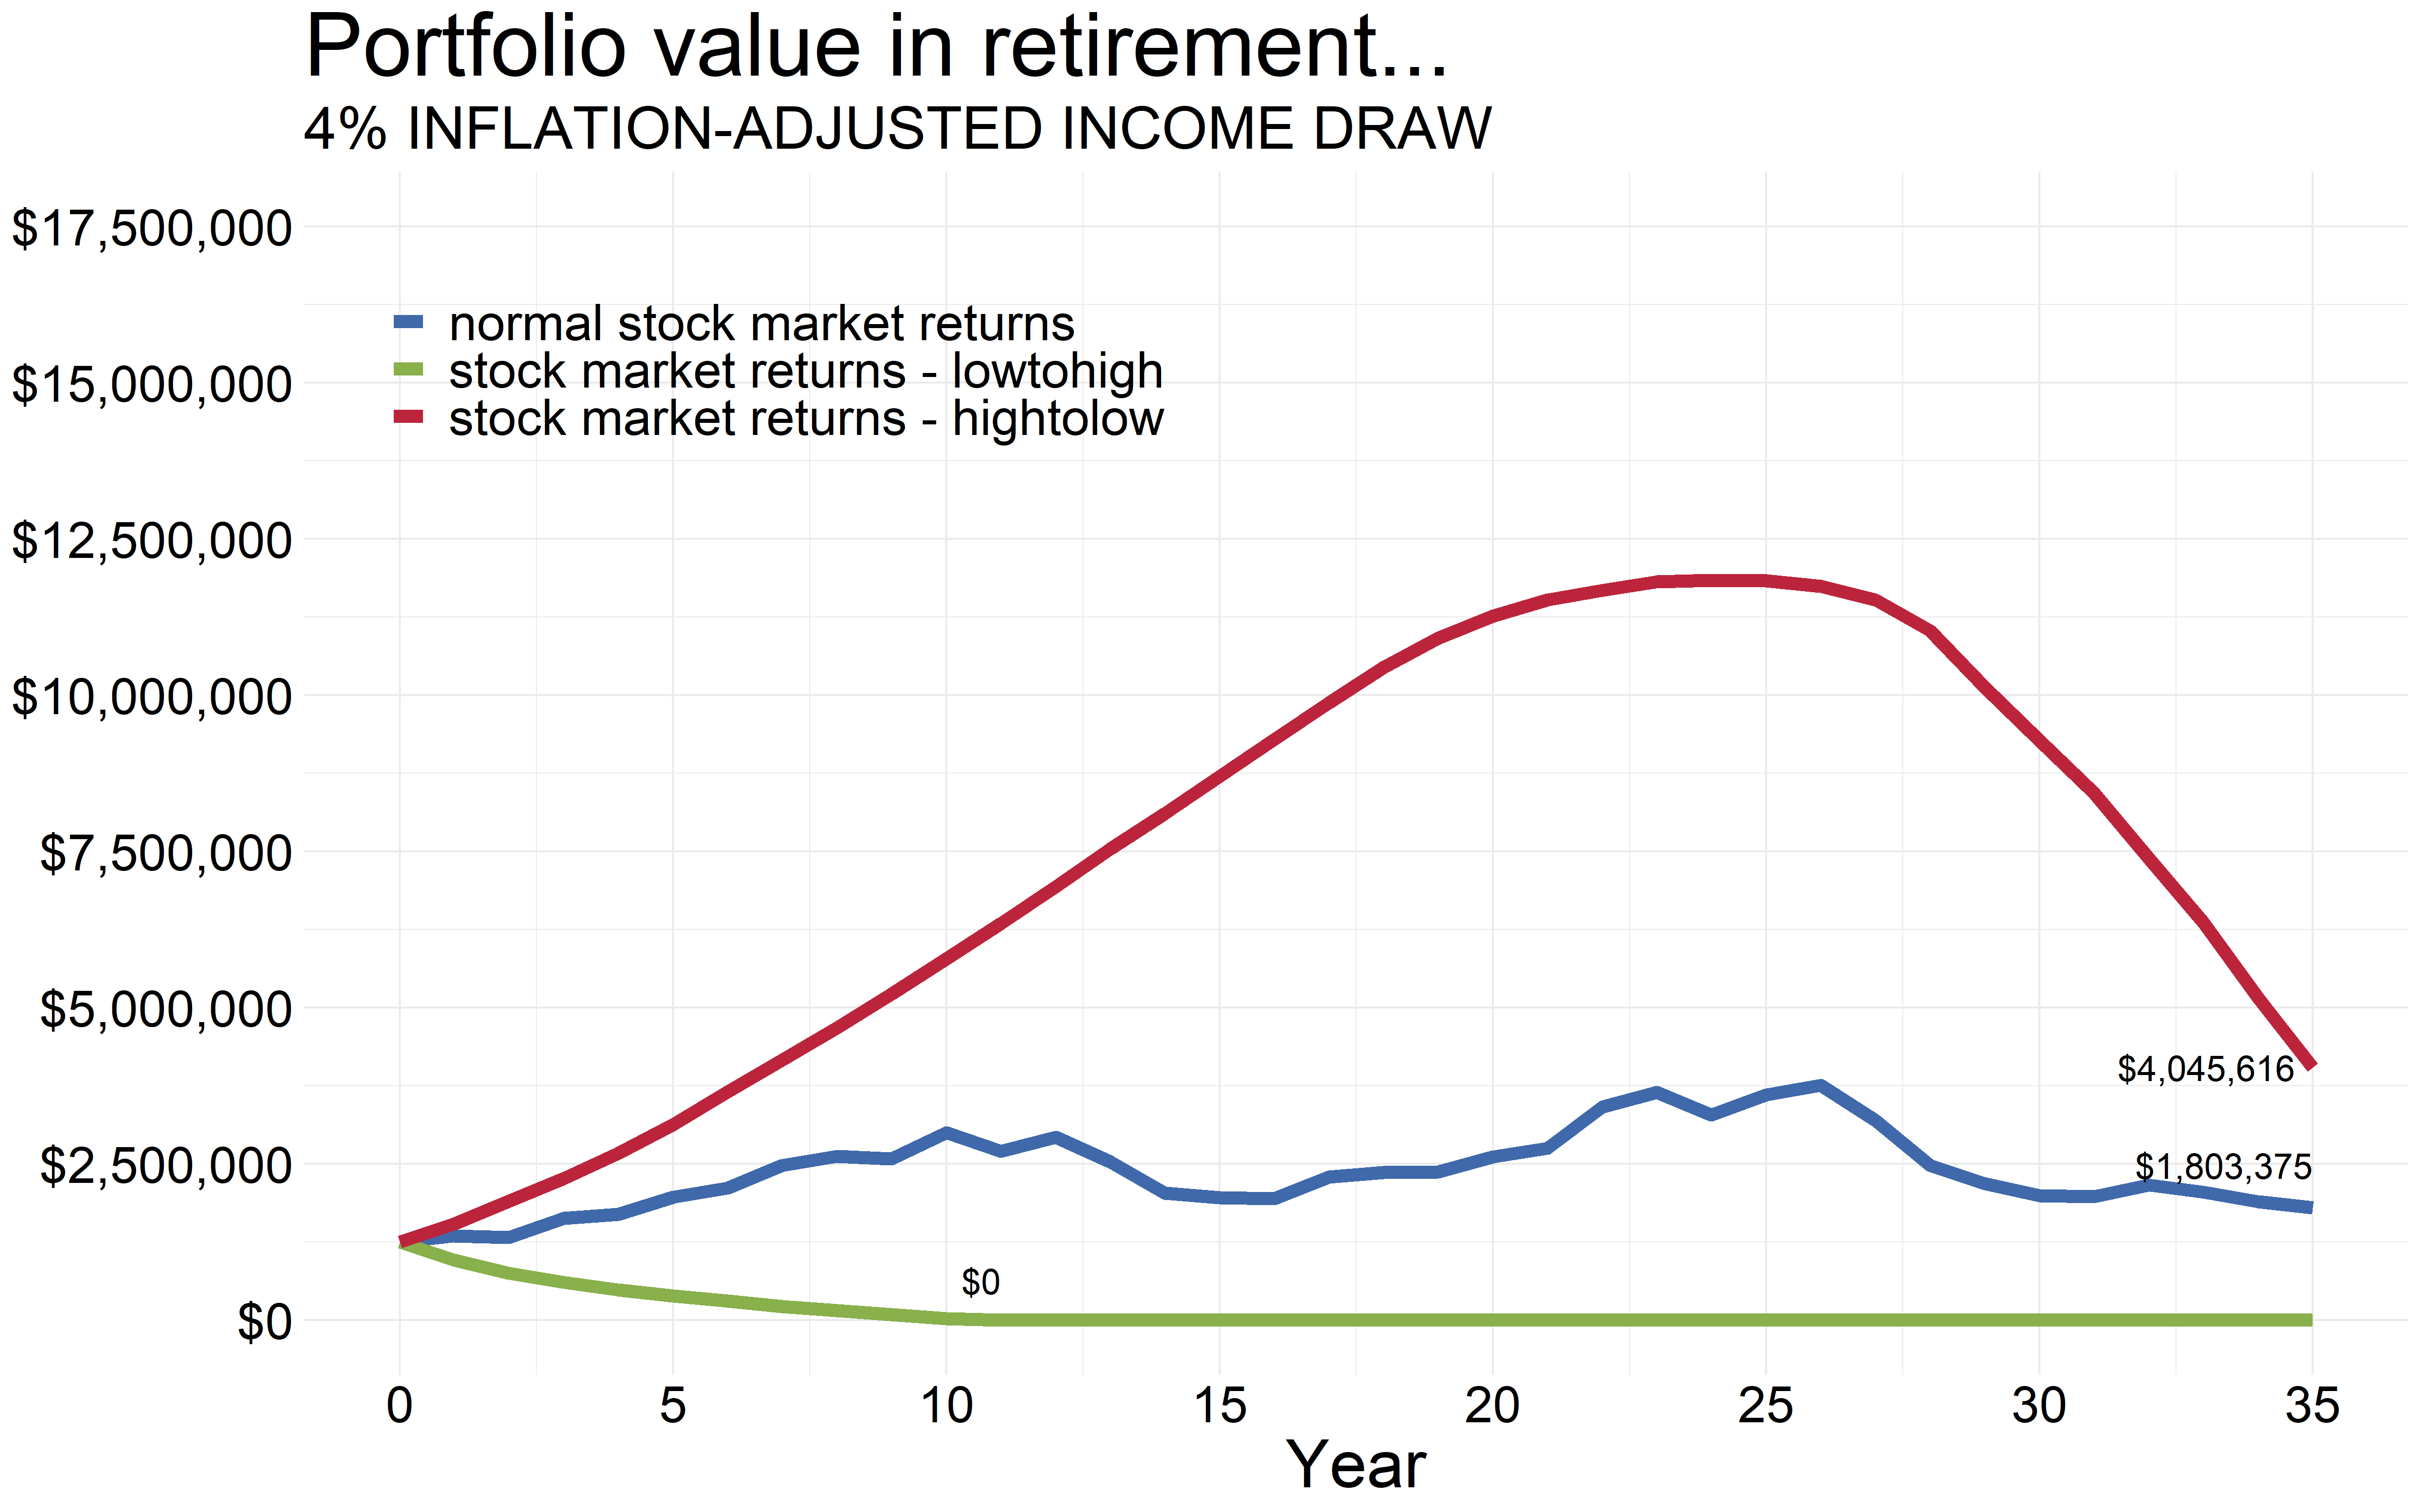
If the stock markets crater first like what would have happened to us if we were unlucky enough to retire say in 2007 or any other prior stock market peaks, we could run out of money very quickly. And that’s with doing everything right. It’s just that we were dealt a bad hand of the returns distribution.
So what do we do? We save more where instead of relying on say drawing 4% from our portfolios, we get by on drawing 3%. Or even 2%. Why? Say instead of a $1.25 million portfolio to start with, if we had saved up double that amount (ouch), that same $50,000 in income need is a 2% inflation-adjusted withdrawal rate. And that could be had from the dividends and interest payments alone without the need to touch principal. Heck, if that is our income need on a $2.5 million portfolio, we can skip owning bonds in entirety and just live on stock dividends in perpetuity and still have plenty left (if that is our goal).
If doubling of savings is not a possibility, another option as highlighted by Dr. Wade Pfau, Professor of Retirement Income Planning at The American College of Financial Services in this piece is to use a rising glidepath approach to stock allocation while simultaneously reducing the bond component of our portfolios in retirement. That’s counter to what traditional asset allocation models recommend but what this strategy entails is starting out with a very low allocation to stocks right when we retire and gradually increasing that to say 100% stocks towards the later stages of our life in retirement. That’s not likely to completely eliminate the risk of running out of money but will greatly improve the odds of being able to sustain our lifestyles during the entirety of our retirement, so the paper says.
Here’s an example of what happens with the three portfolio return scenarios when we start out with a 10% allocation to stocks and incrementally increase that to 100% stocks through retirement.
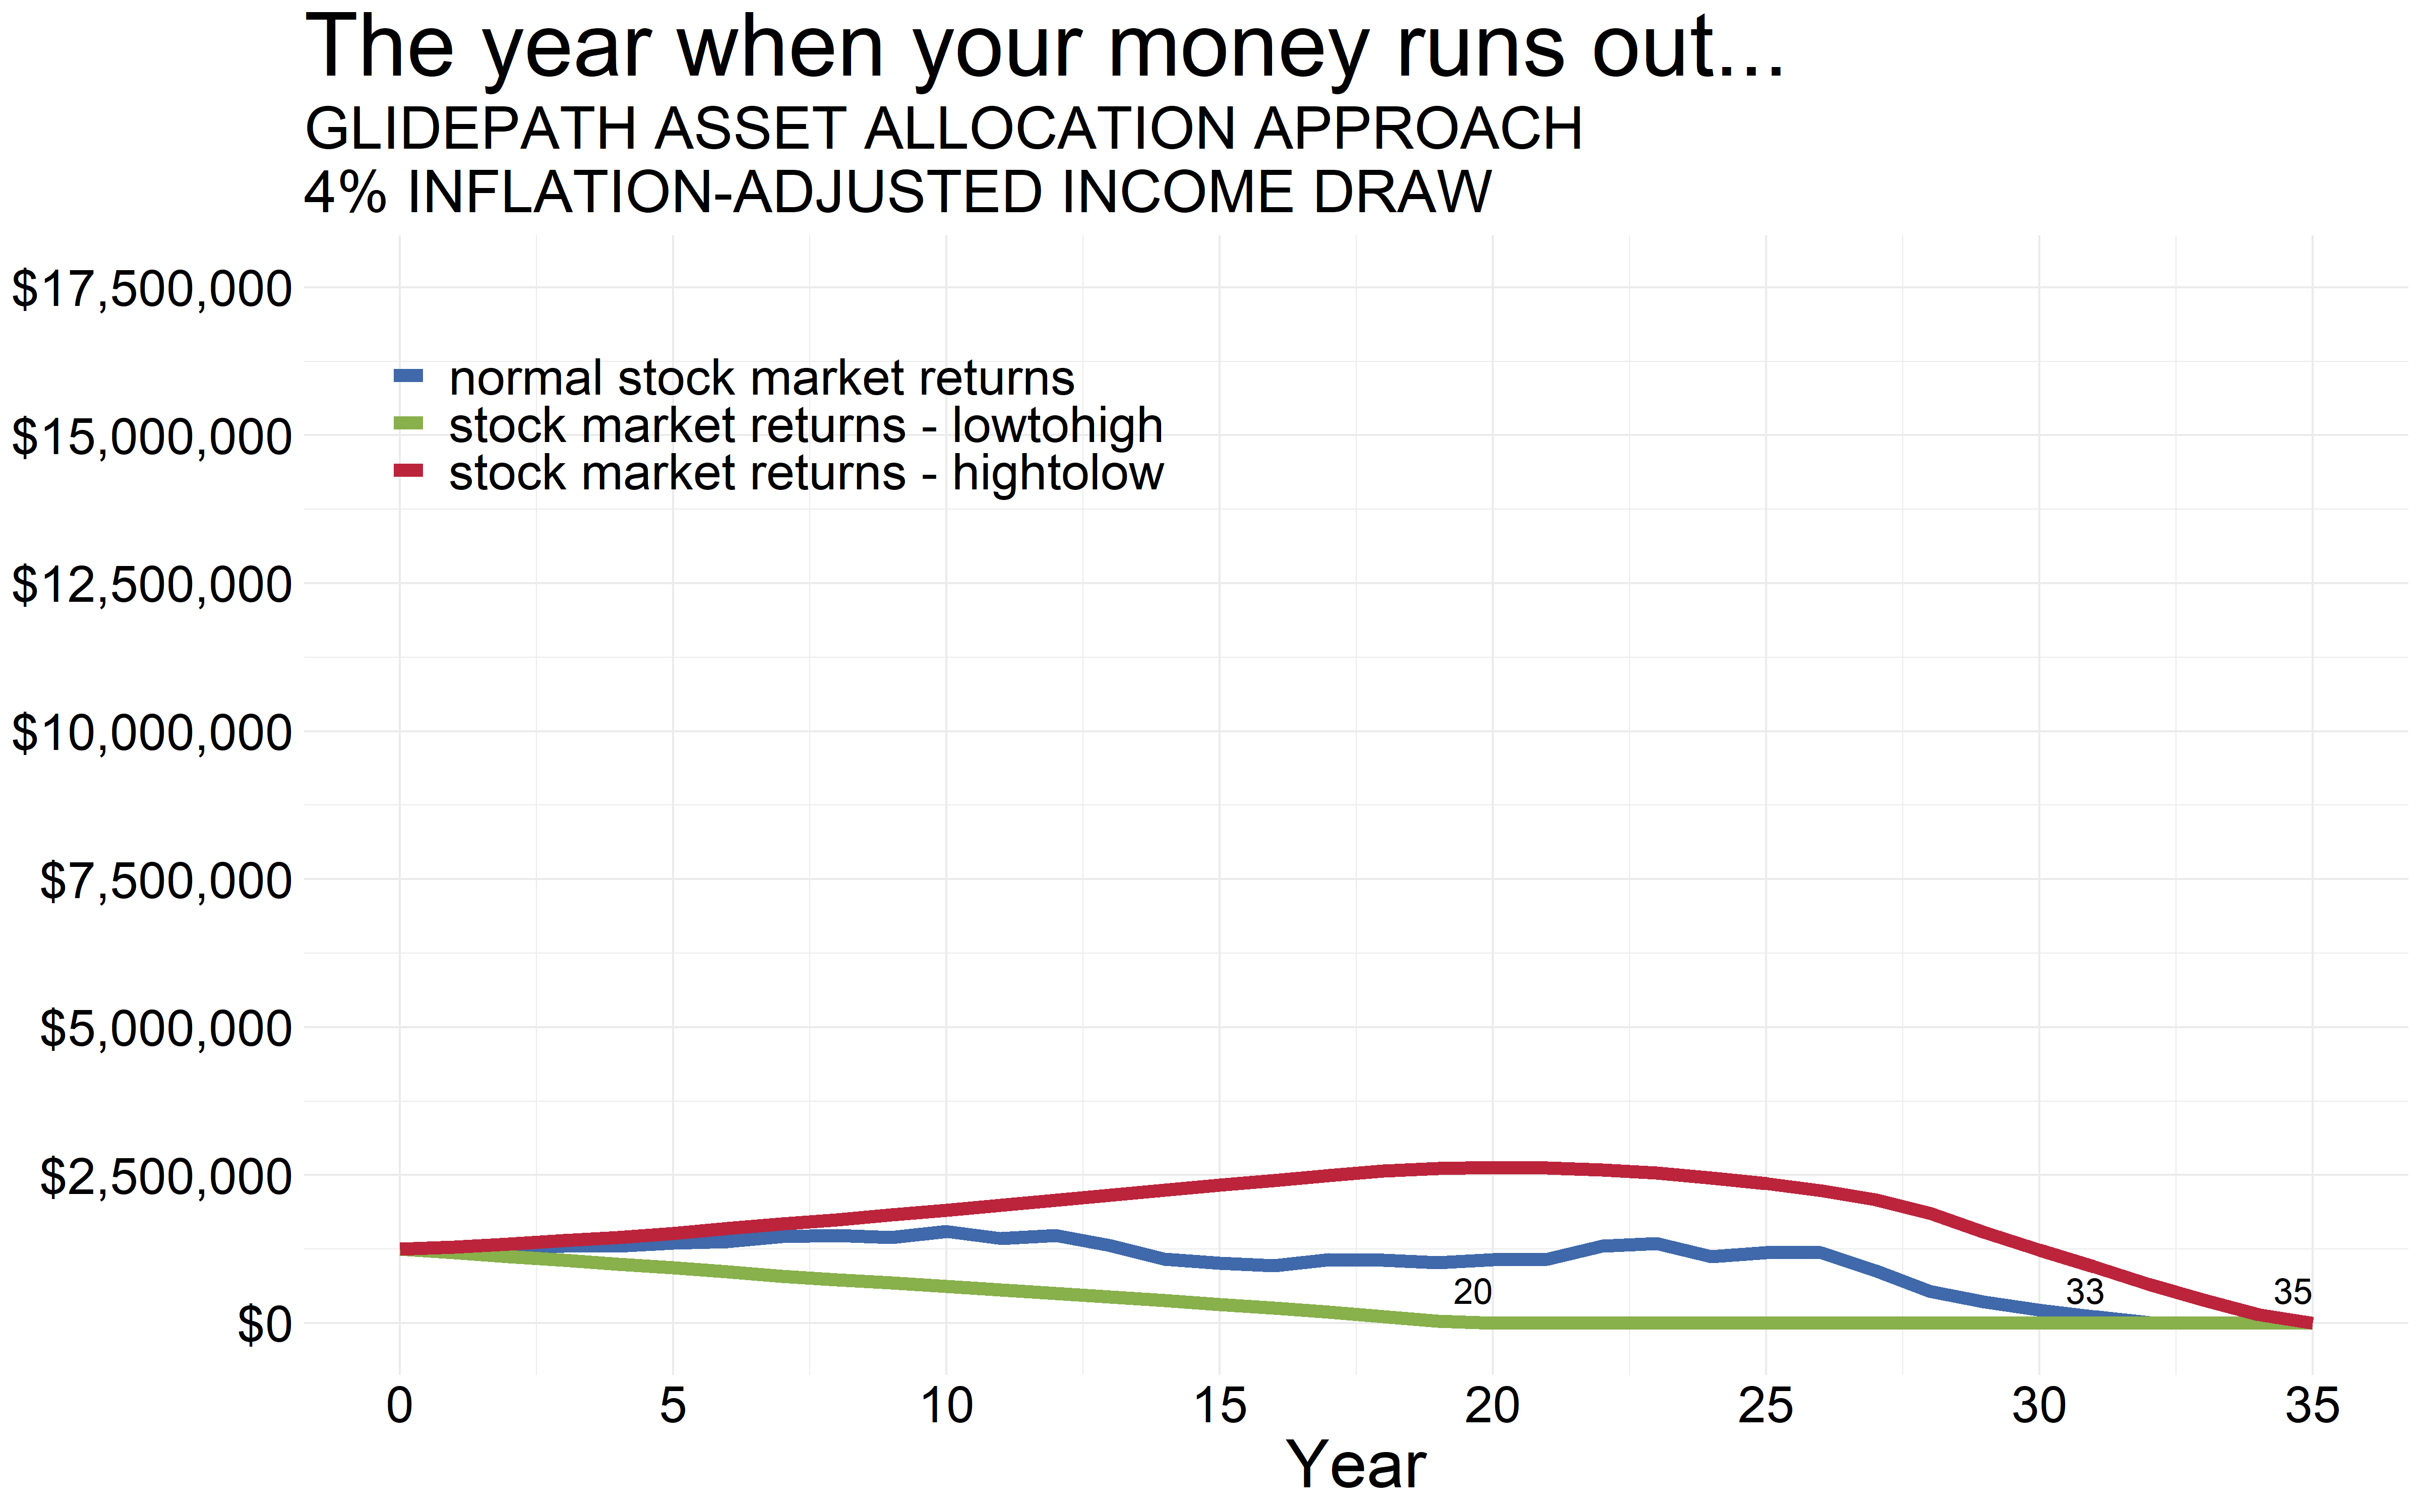
So now, instead of running out of money in say year 10 for the worst-case sequence of returns pattern, we were able to extend our income drawing time-frame by double the number of years.
But this apparent safety does not come free as seen by the ending portfolio values for the other two scenarios.
So that was a lot of number crunching and pretty plotting but in an environment where future capital market returns are expected to be low, saving more buys us that ticket to not becoming a victim to an outlier event. Because to quote from that same book by Peter L. Bernstein again,
The essence of risk management lies in maximizing the areas where we have some control over the outcome while minimizing the areas where we have absolutely no control over the outcome and the linkage between effect and cause is hidden from us.
So market returns will be whatever they will be but we know this one thing that still remains in our control and that is how much we save. And of course, the sooner we start, the more time we have for the money to compound and the easier the going gets.
Thank you for reading.
Until later.
Cover image credit – Artem Bali, Pexels