

S&P 500 is the barometer for the U.S. stock market. And why should it not be. One look at its top ten holdings says it all.

Or does it?
First, because it is market-cap weighted, the biggest companies occupy too much of your portfolio if this is all you own. Nothing wrong with that but just to give you some perspective, these were the companies that occupied its top 5 slots in the year 2000: General Electric, Exxon Mobil, Pfizer, Citigroup and Cisco Systems.
Things change so diversify.
Second, S&P 500 is a large cap index. It owns the biggest 500 public-traded U.S. businesses. So when you own just this, you own only one flavor of the market.
Third, tech businesses have come to occupy too big of a share of the index lately. And many of the tech businesses trade at valuations far richer than the overall market, some justifiably so, many not so.
And the reason the market affords a much higher multiple to these growth-oriented names is because of the historically low interest rate environment we find ourselves in. And low interest rates means equally low discount rates.
But then they are also more sensitive to changes in interest rates so if and when rates rise, the value of these growth-aligned businesses will decline, oftentimes precipitously.
And if what you own in your portfolio is skewed towards these names, your portfolio will suffer. It will eventually recover but that recovery could take much longer than your patience can handle. The decade of the 2000 is a perfect example. If a portfolio of S&P 500 is all you owned, you had less money at the end of that decade than at the start. We often forget but then we have the data.
But enough with the ramble and on to some number crunching. We’ll run through some test portfolios that are exclusively invested in one type of stocks and compare that to the one that’s globally-diversified across size and value spectrum yet still 100 percent invested in stocks.
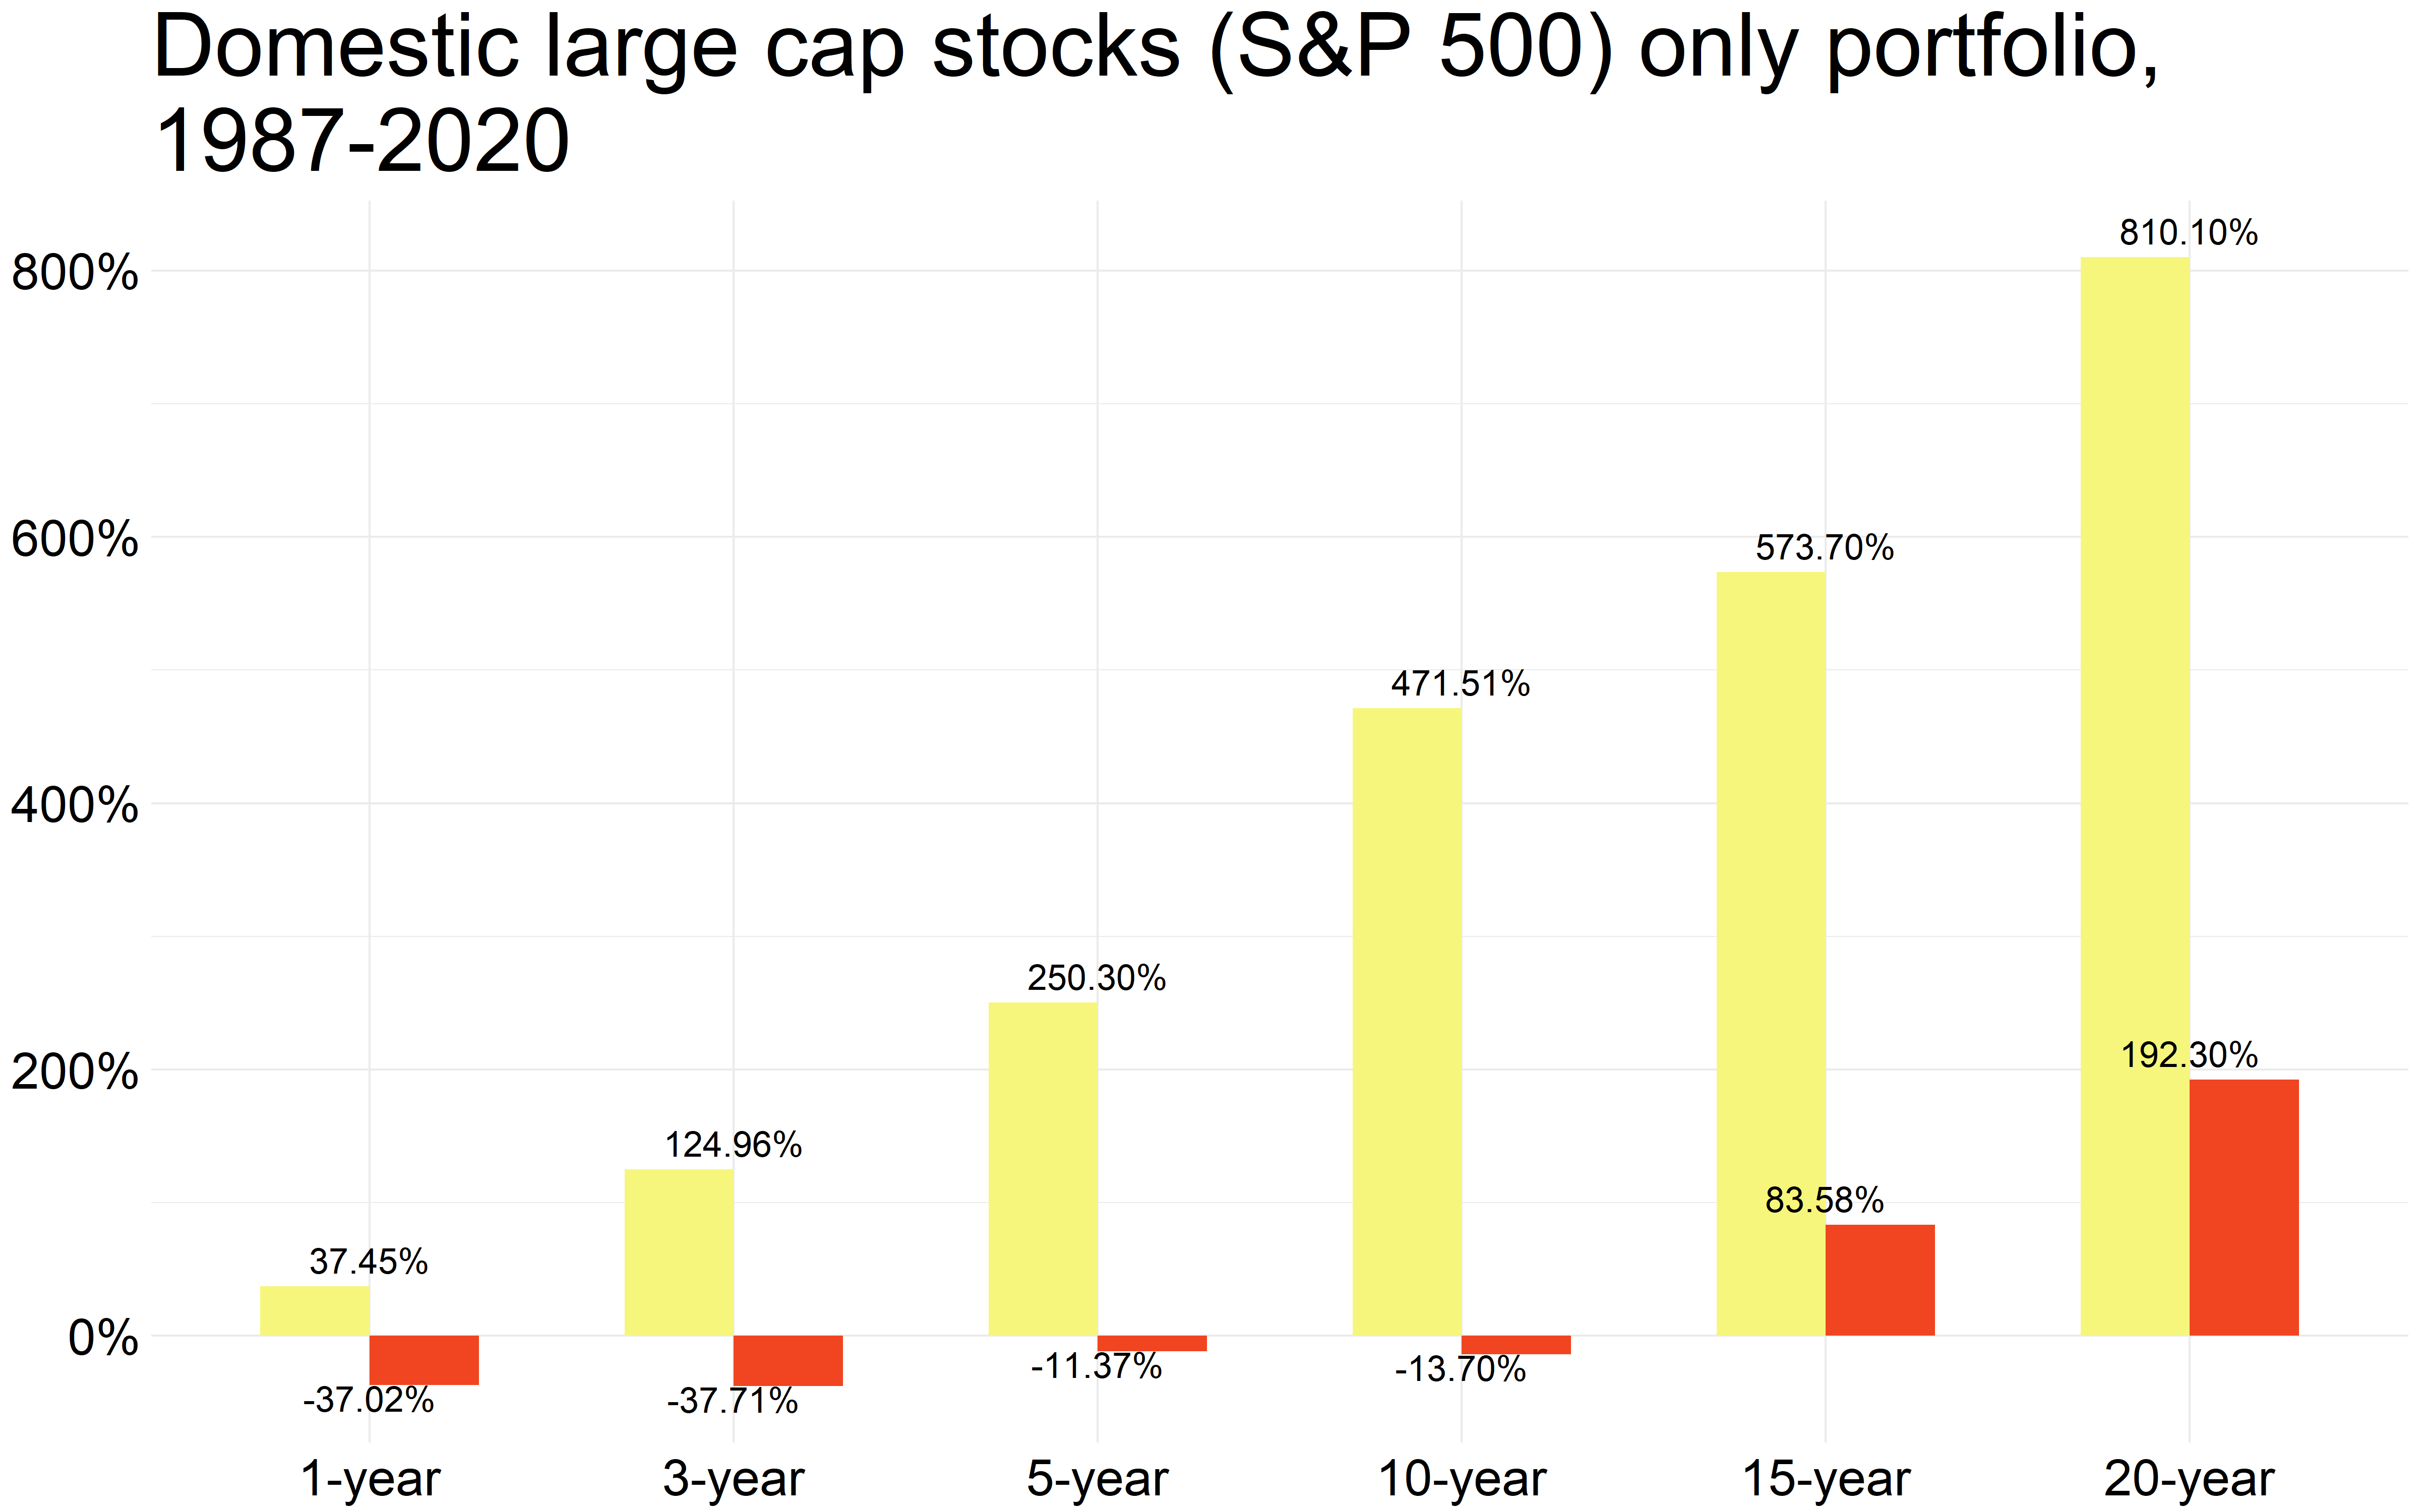
The first is an S&P 500 only portfolio. Of course, this is past performance and future performance can and will differ but one thing I can almost reliably say is that if you expect an S&P 500 only portfolio to do over the next decade what it did over the last, it’s not going to happen. It could if business profits suddenly explode to the upside due to some breakaway technological advancements but these things don’t happen that often and hence.
So this below is the best and worst-case rolling returns of an S&P 500 only portfolio over these past many decades.
And just to give you some perspective on all the things that transpired during this timeframe:
- The 1987 stock market crash.
- The Savings & Loans crisis of the late 1990s.
- Gulf War I.
- Real estate recession of the early to mid-1990s.
- The Asian financial crisis 1997-1998.
- Dot-com boom and then a bust 1995-2003.
- 9/11.
- Gulf War II.
- The housing market crash and the ensuing global financial crisis of 2008.
- The European debt crisis 2012.
- And of course the pandemic.
And embedded in between these major events are the many micro booms and bursts that happen from time to time. They will always happen because it’s systemic. It’s the nature of the markets.
This below by the way is the exact annualized performance of an S&P 500 only portfolio over these last two decades…

What stands out is how most of the gains are back-loaded. That’s because S&P 500 sucked wind the entire decade of the 2000s. All the gains are packed in the decade that just ended.
So the best time to have loaded up on large-cap U.S. stocks was in 2010, exactly the time of maximum despair for a large-cap only portfolio.
But then there are businesses that are not in the S&P 500 that are smaller in size that can be found in say the Russell 2000 index. Smaller businesses are usually risker, both in terms of price volatility and in terms of their ability to survive.
The best and worst-case rolling returns for a small-size companies only portfolio over these last many decades…
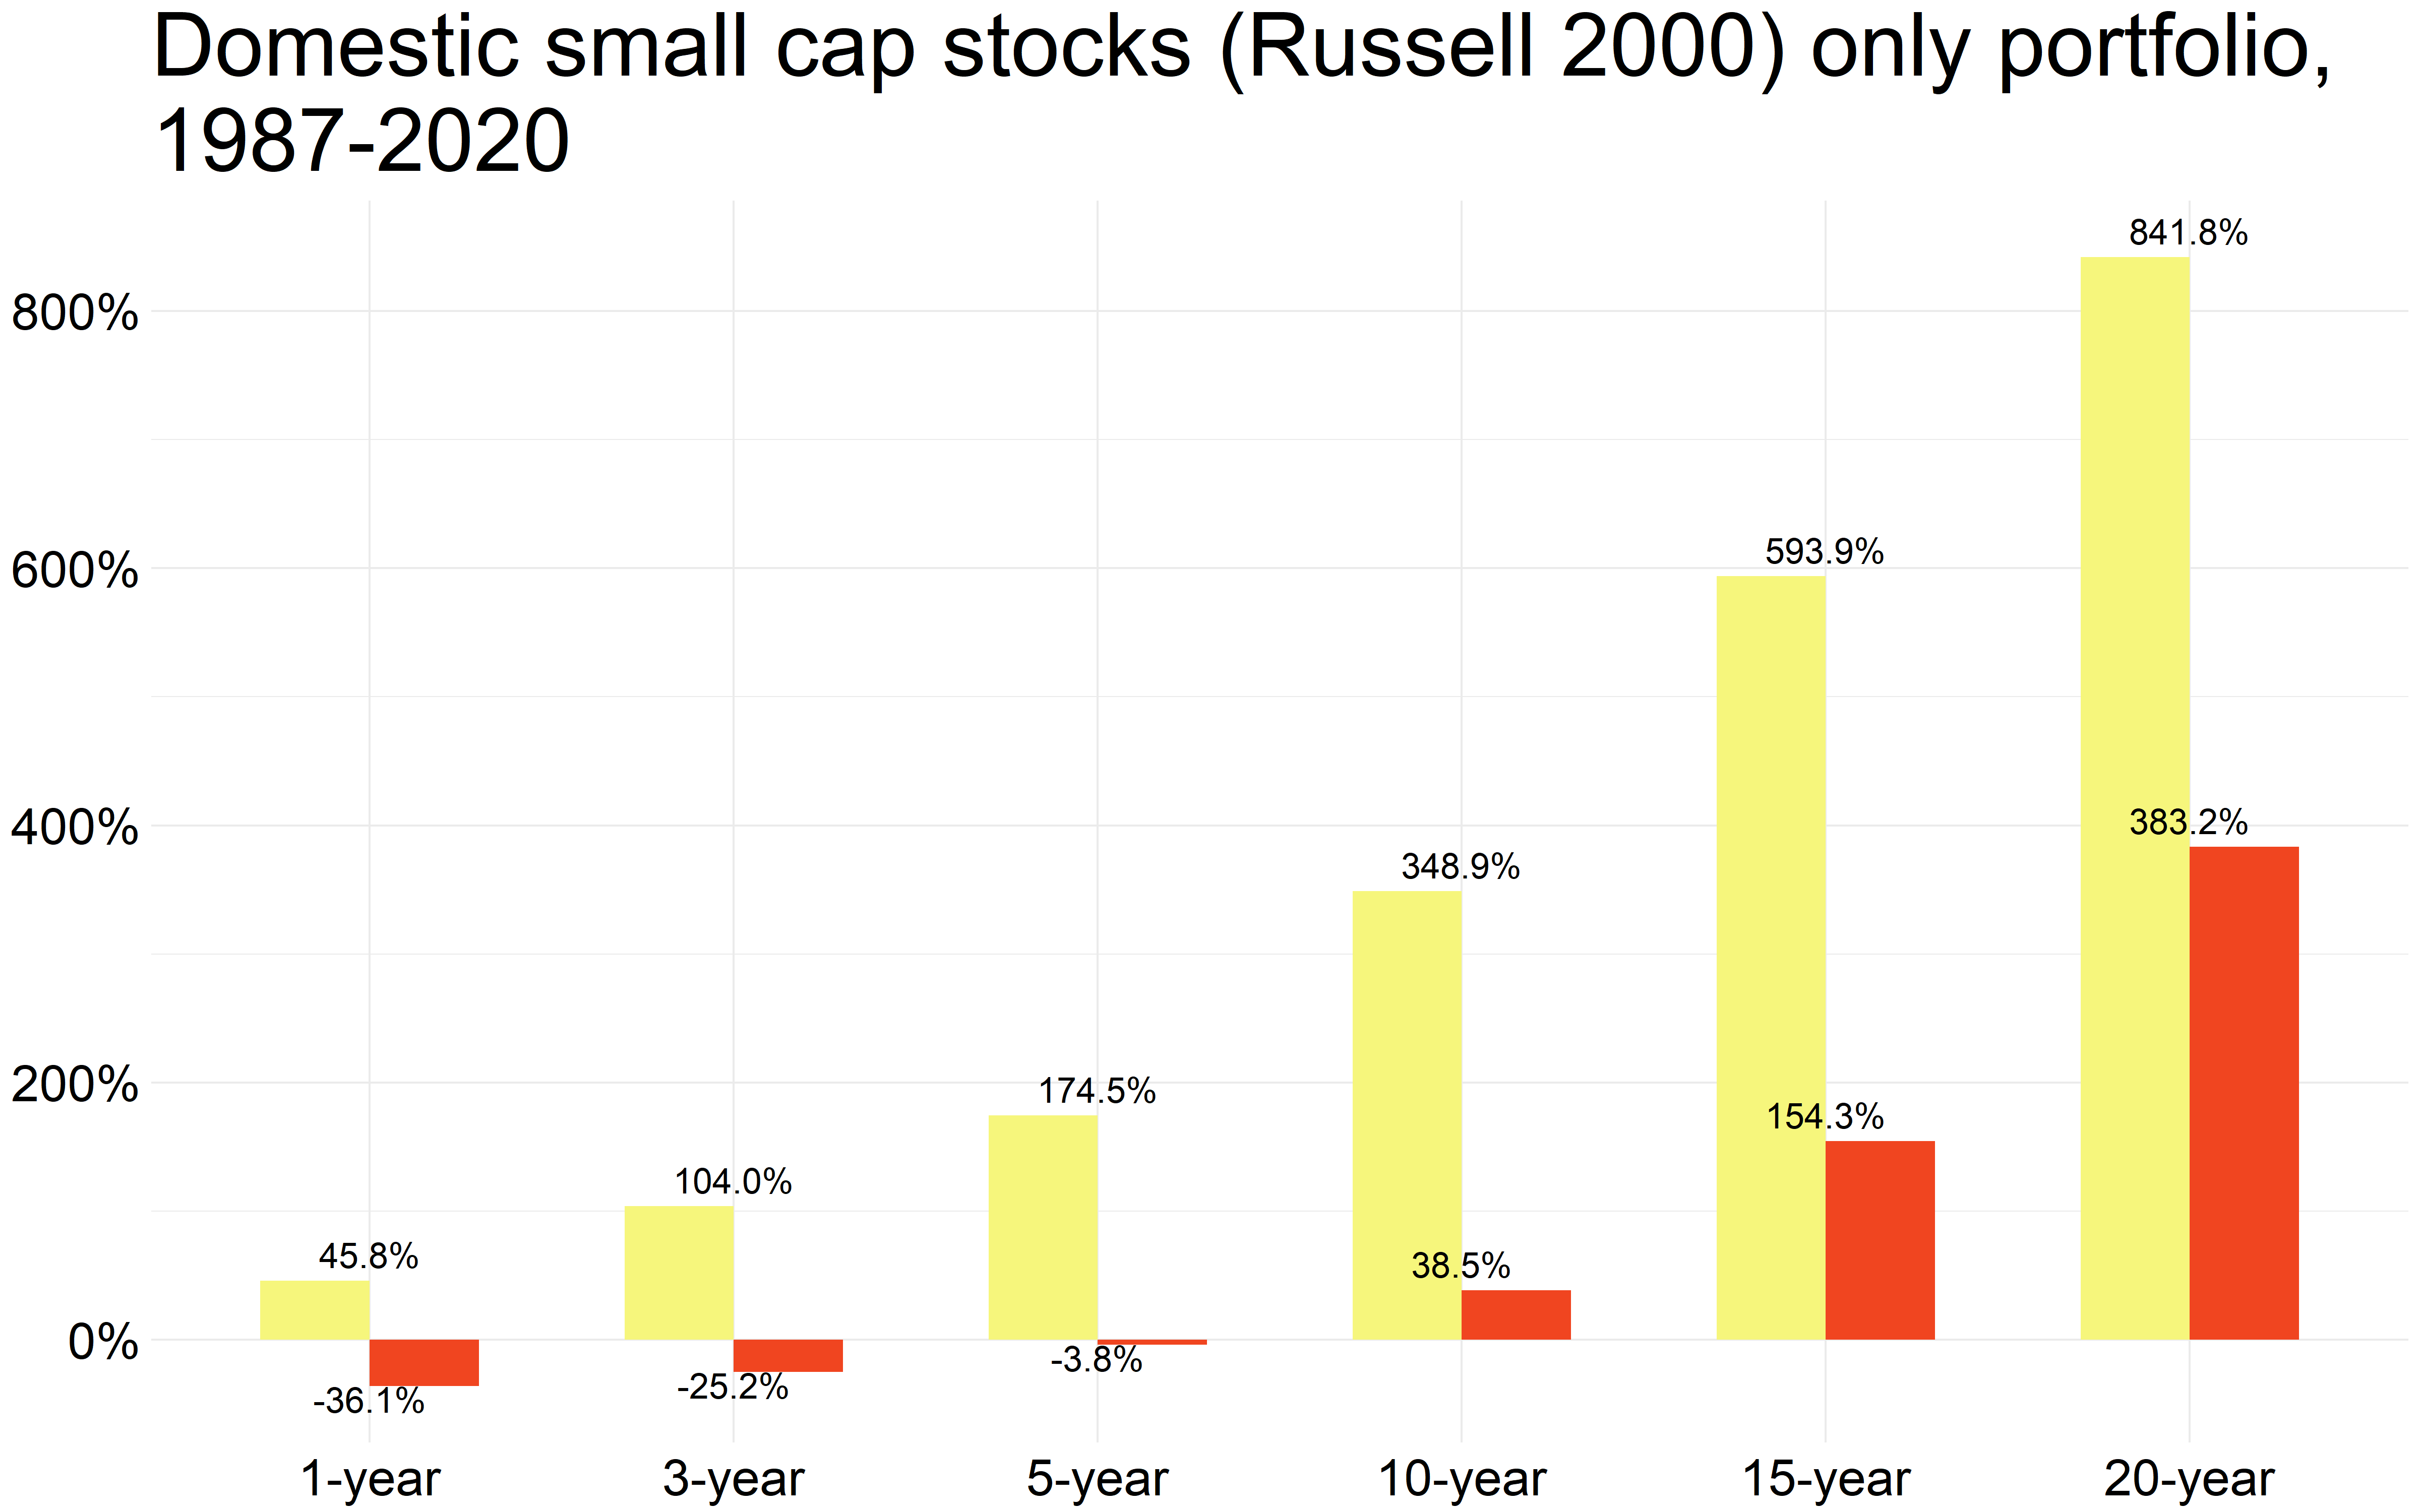
And the actual annualized return for these businesses going back 20 years…

The shocker is not that small companies earned more over time. That’s expected. Not guaranteed but expected.
The real shocker is that they made you more money with less risk than their large cap brethren (compare the 10 and 20-year rolling portfolio returns for the S&P 500 only portfolio vs. the Russell 2000).
Now spreading our wings a bit more and looking beyond our borders with international stocks with a great barometer for that being the EFA index, EFA as in the Europe, Far-East and Australasia.
The same rolling returns for an EFA-only portfolio of stocks…
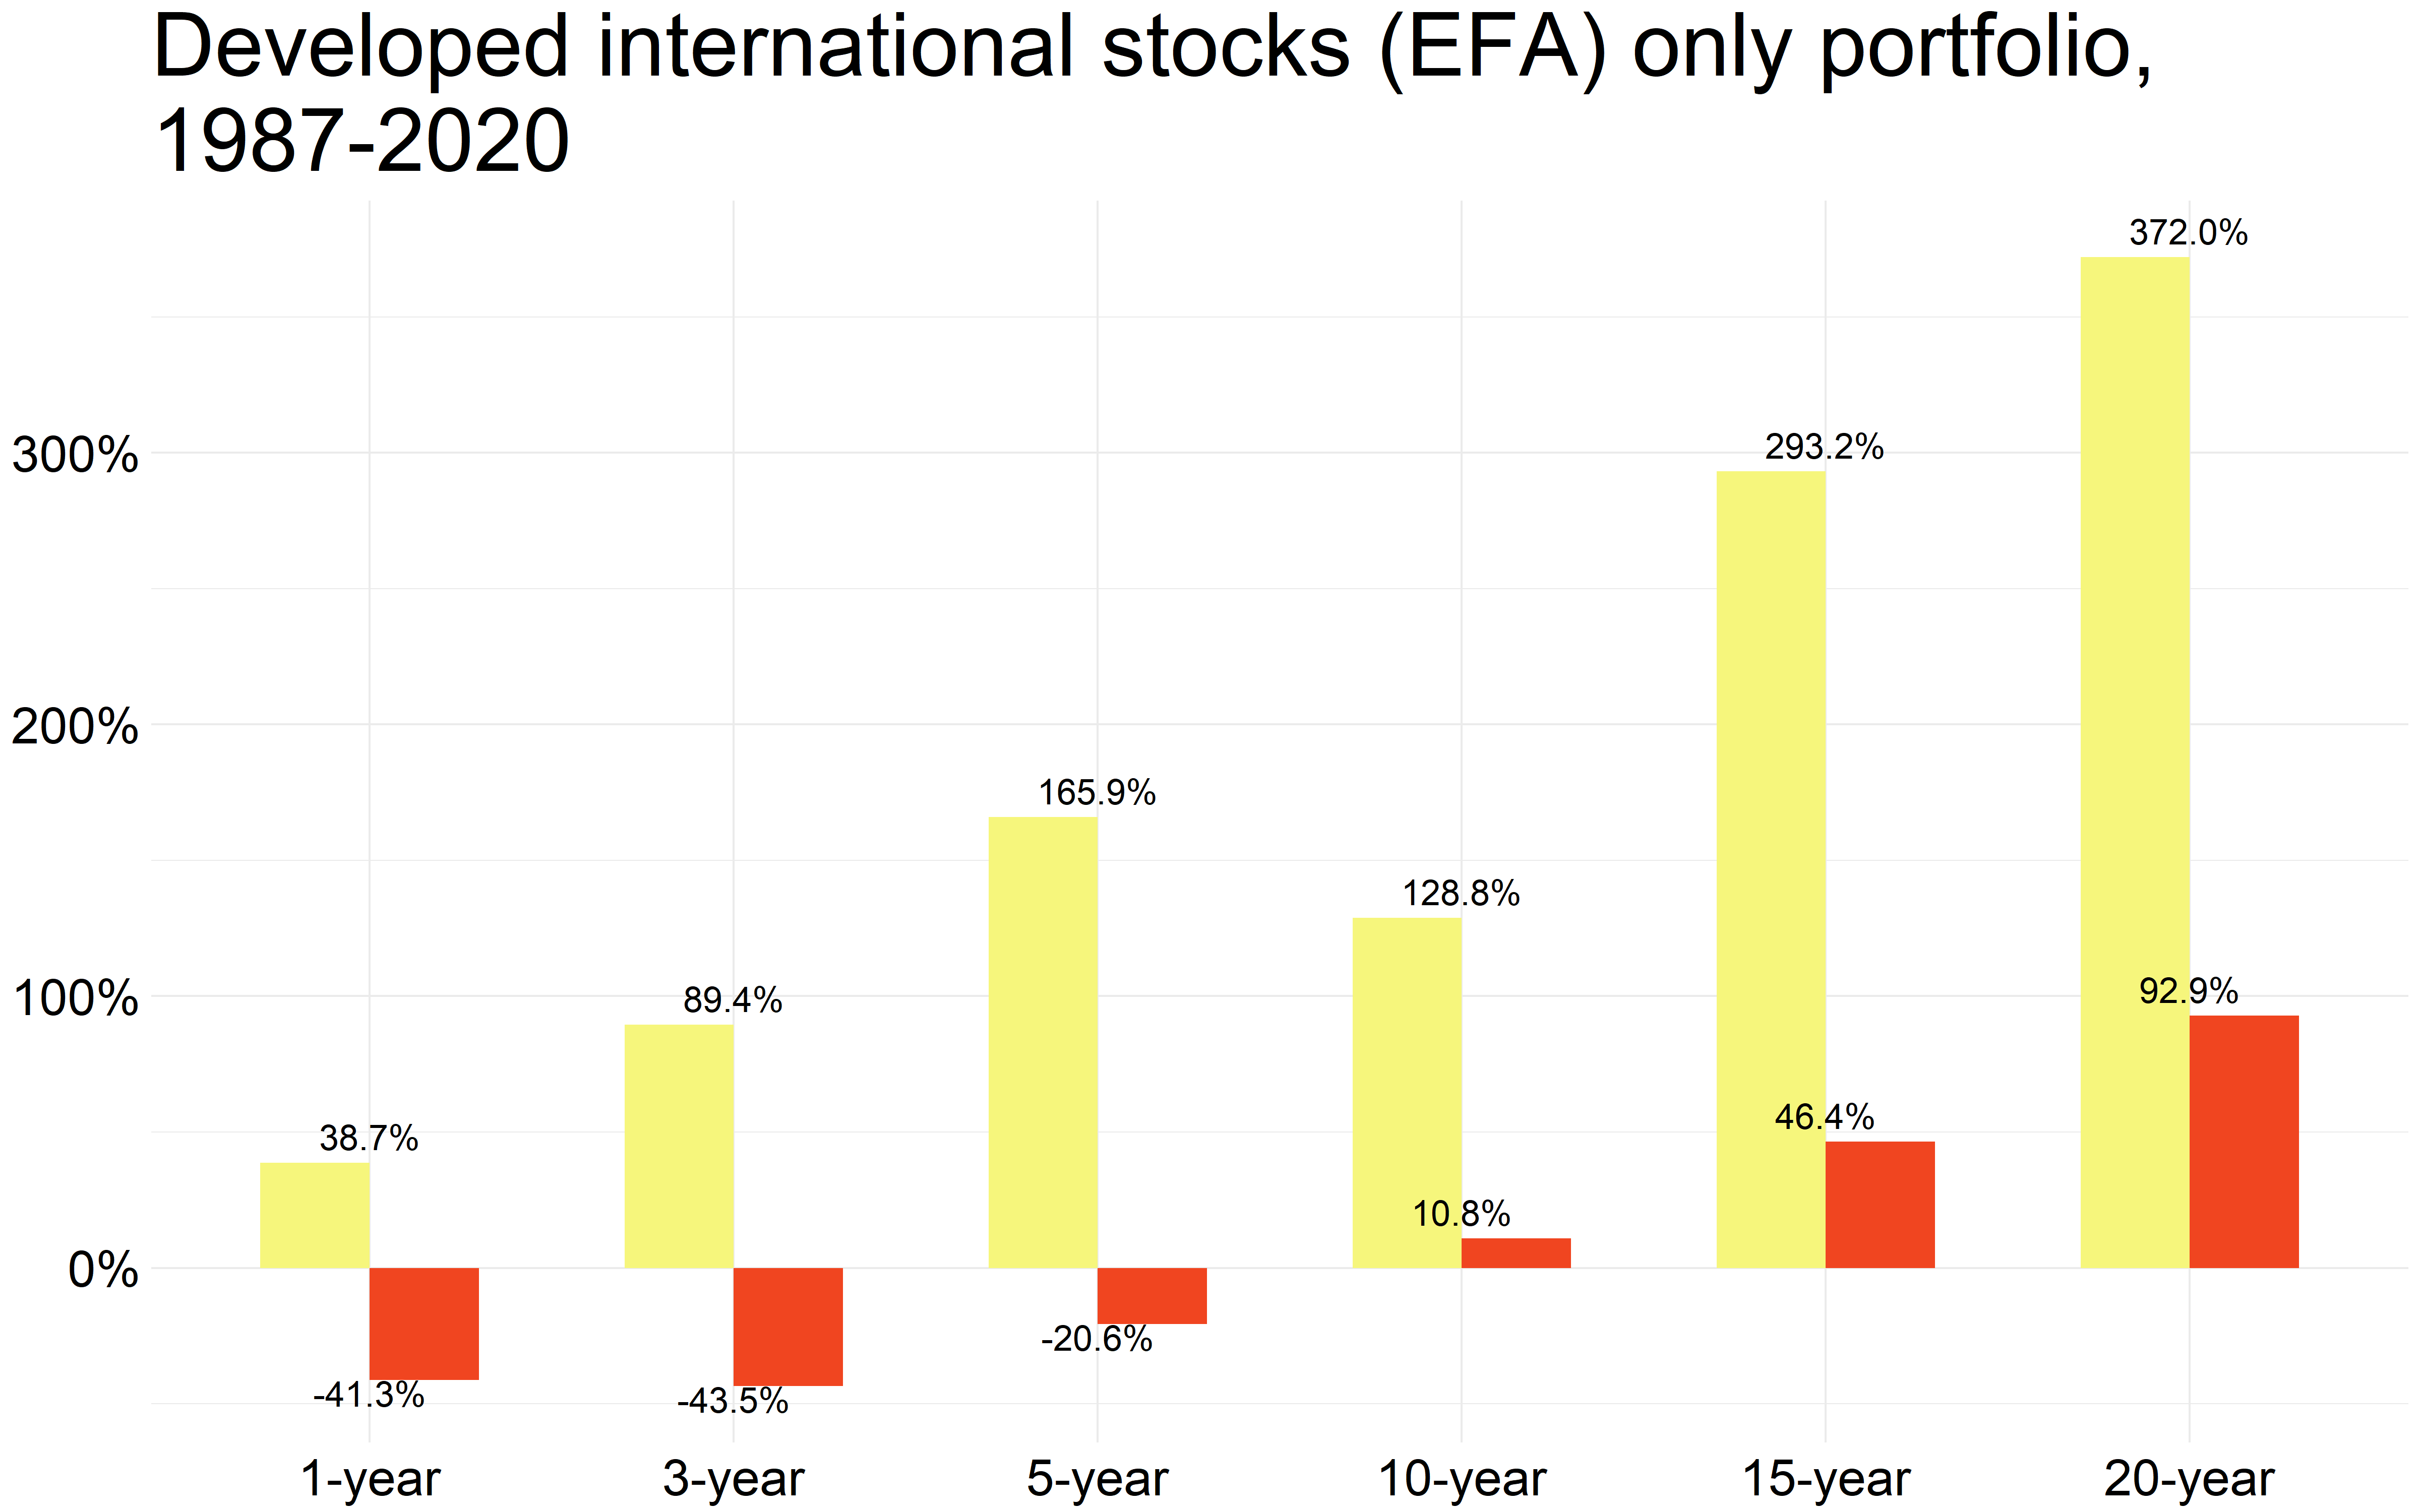
And the exact annualized returns for that EFA-only portfolio over the past two decades…

So not that hot compared to say the S&P 500 or the Russell 2000 but that’s expected. International stocks have treaded water for quite some time but that’s the nature of the game. They will shine again at some point, no one knows when yet no big deal.
But now we’ll mix and match all these and bring in emerging markets, value stocks, mid-size companies etc. that exposes a portfolio to all available factors and possible outcomes. The exact portfolio is not as relevant because there are tilts and tweaks you can apply based on where you find a better bang for your buck at any given moment but assuming a portfolio that’s designed keeping first principles in mind, you won’t go wrong. And of course assuming a portfolio that you will stick with, come hell or high water.
The rolling returns first…
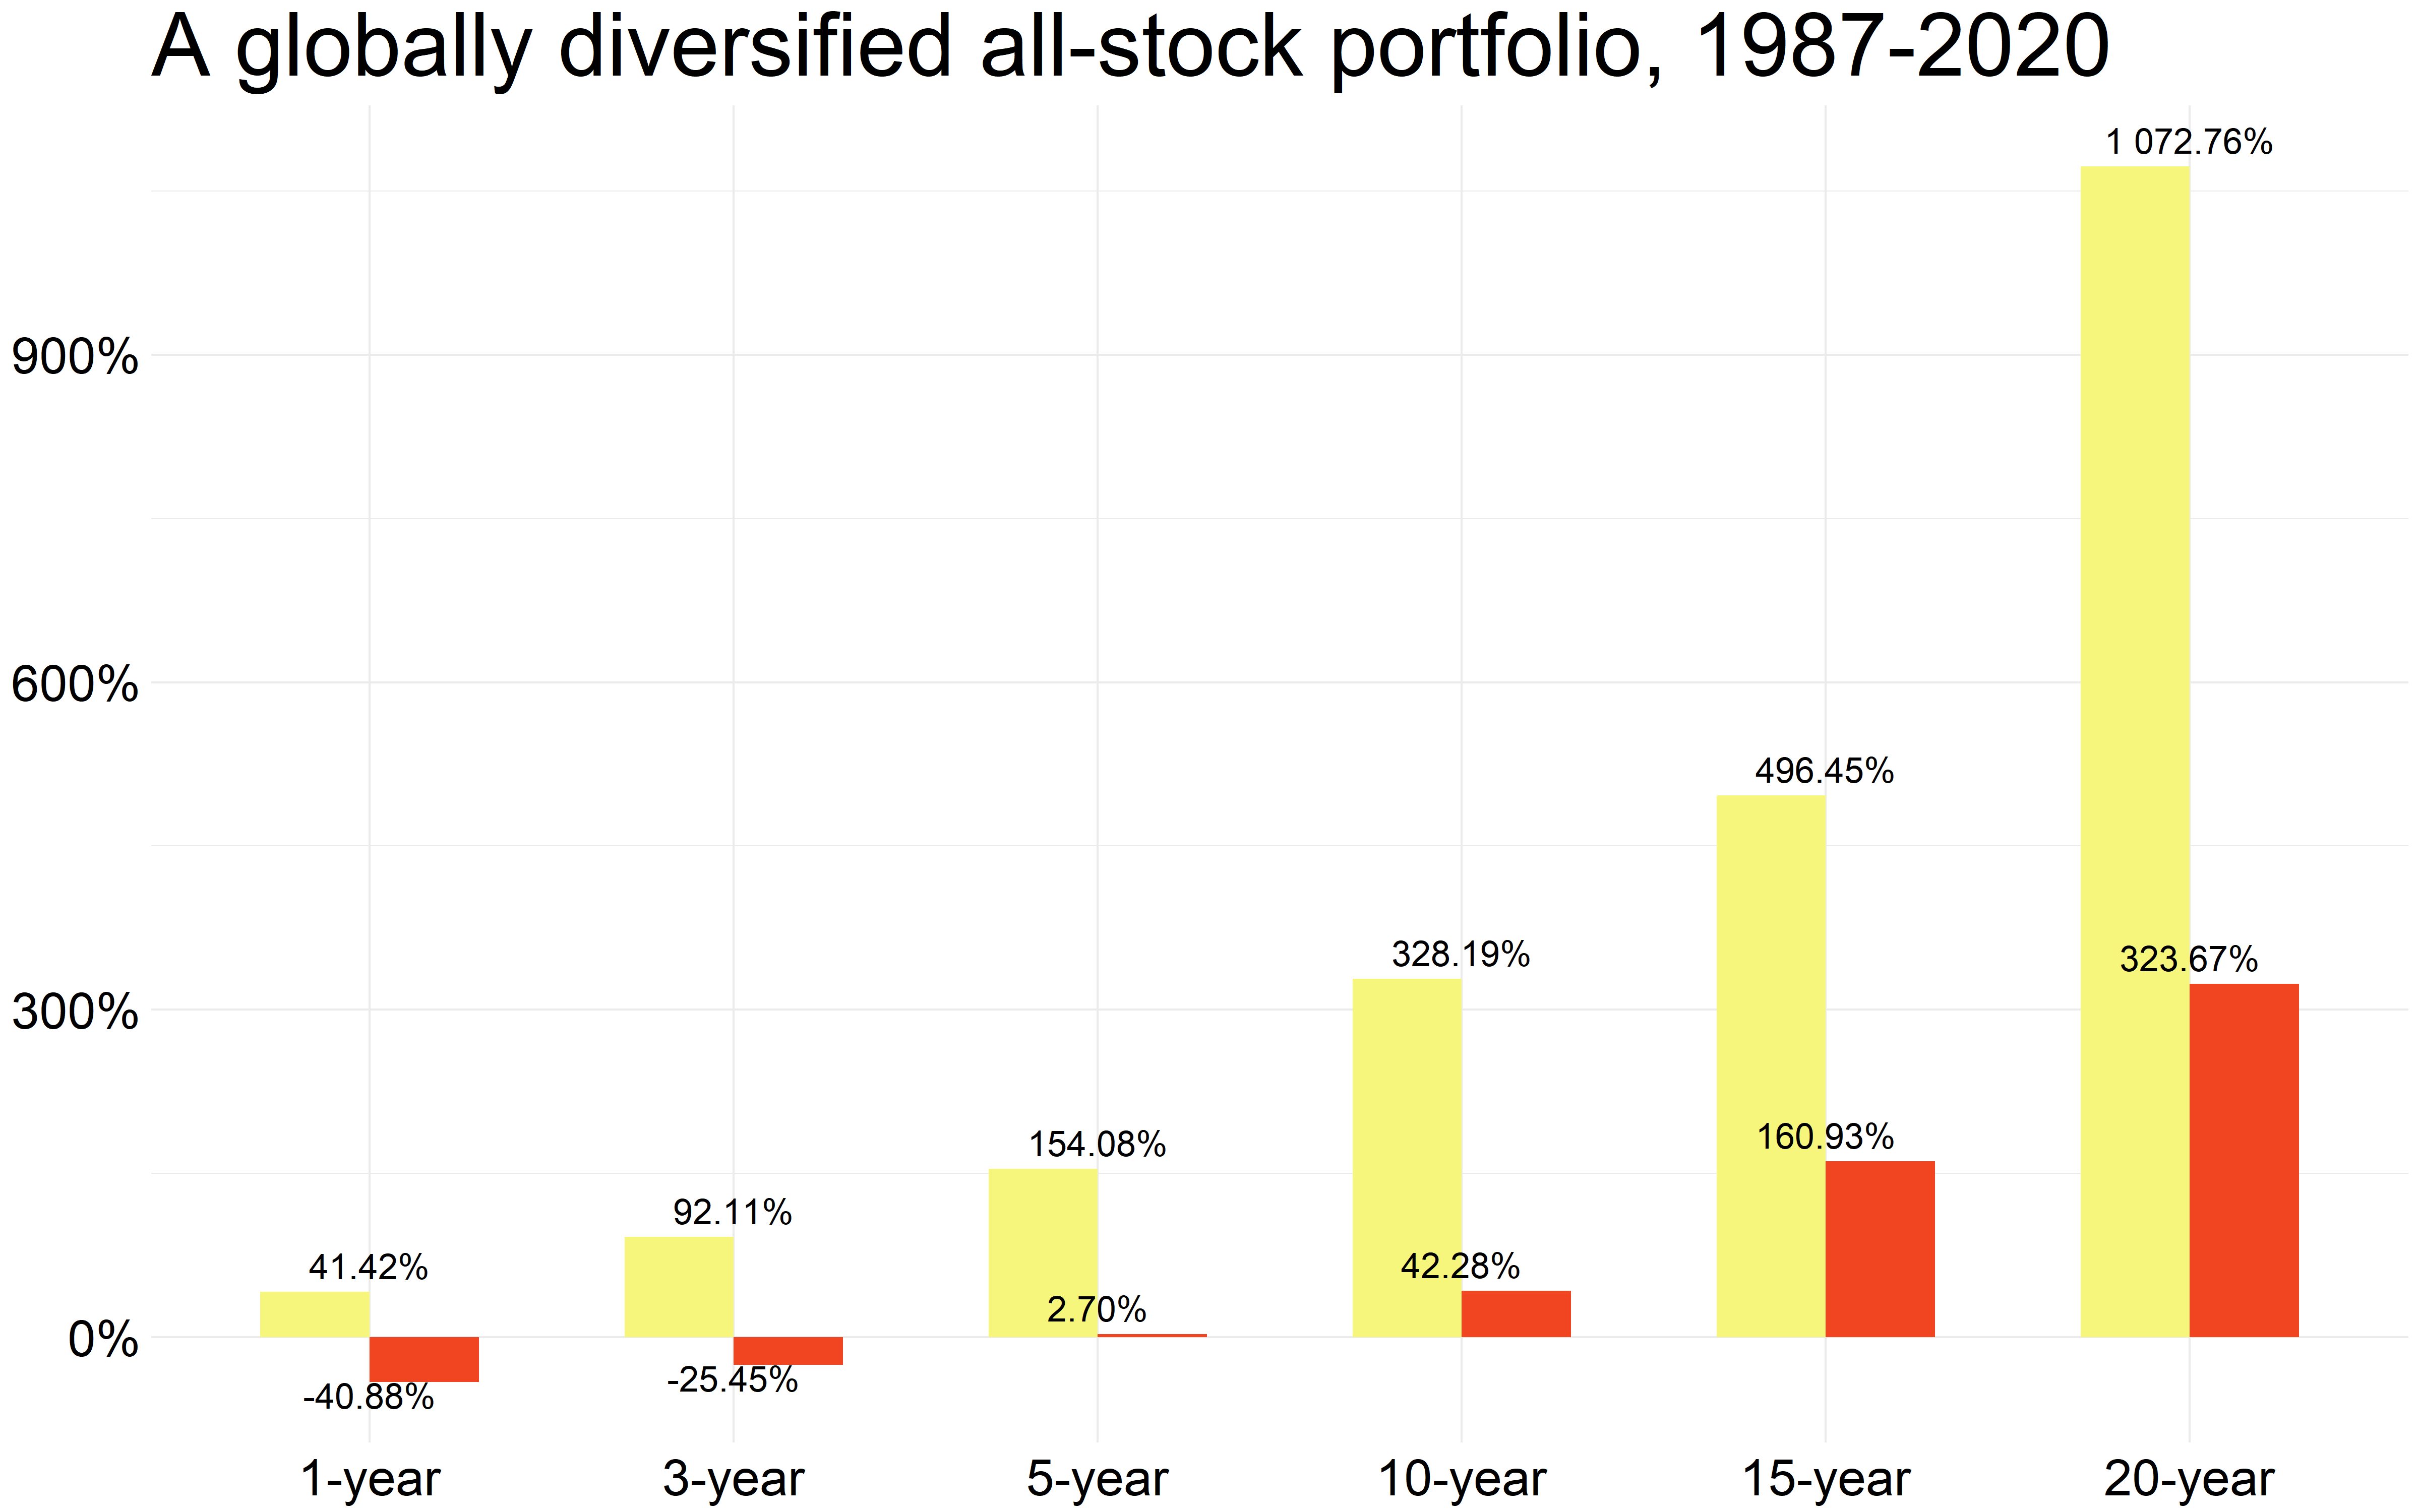
And the exact annualized return for that global all-stock portfolio over the last two decades…
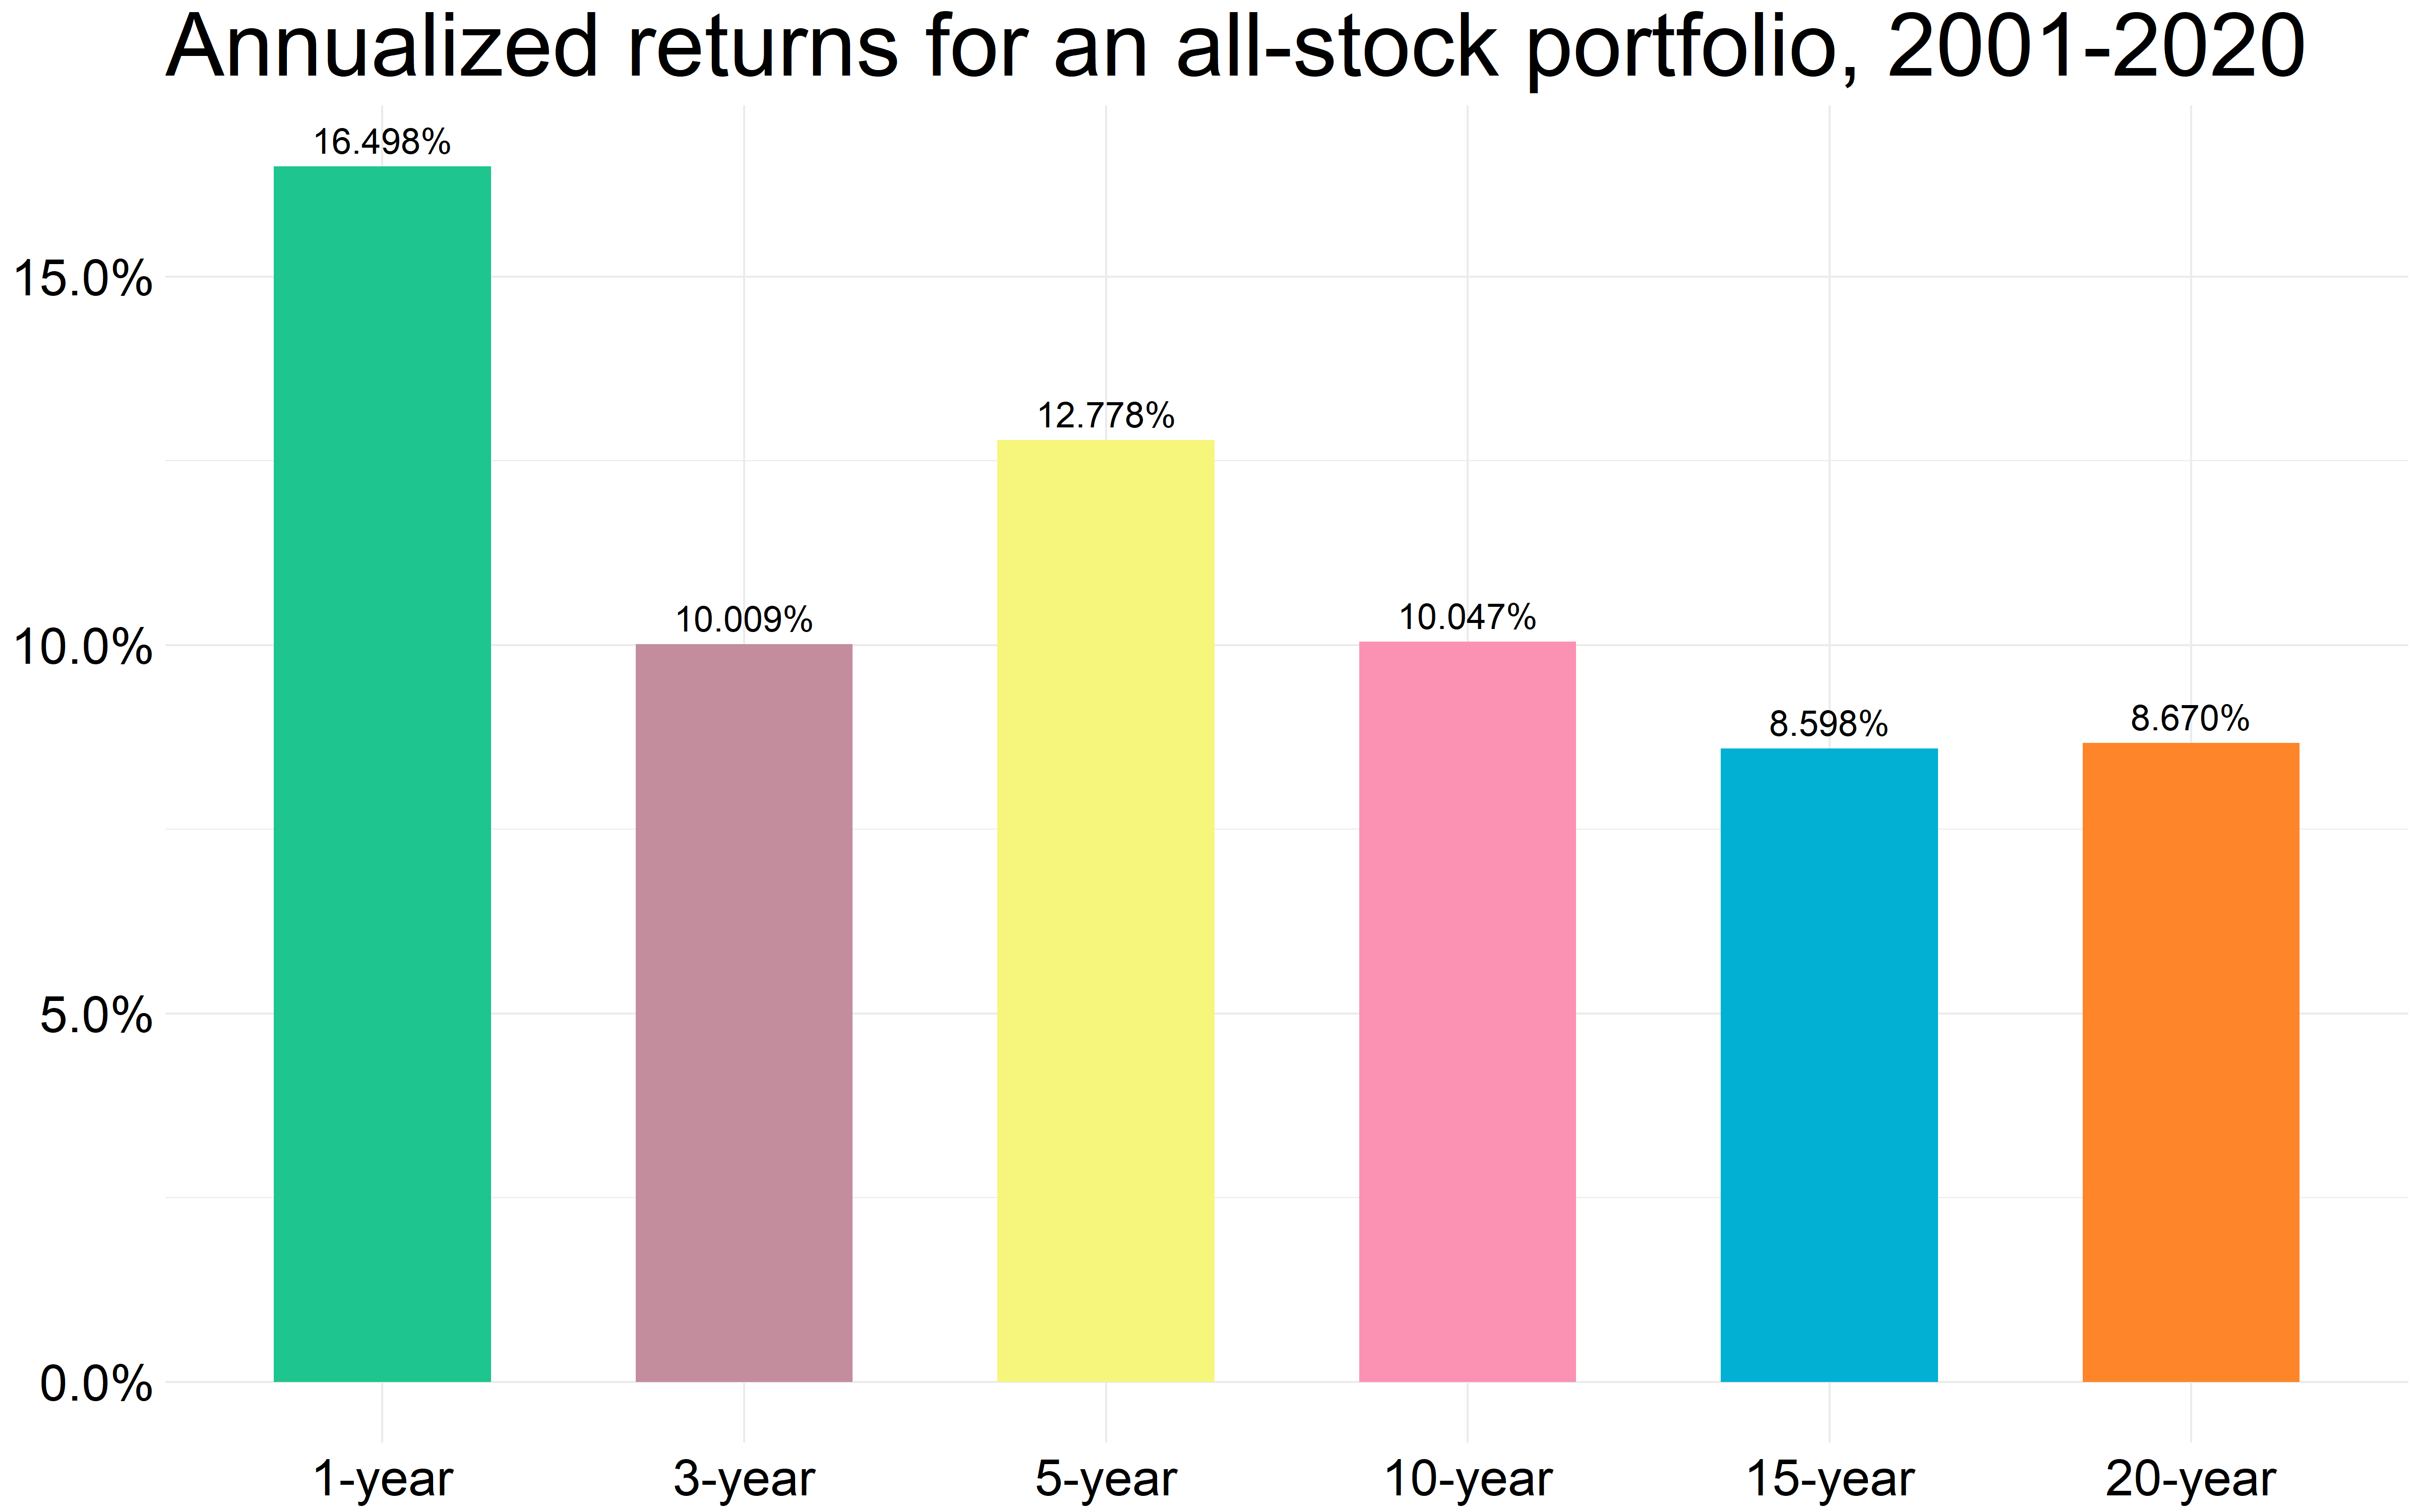
A few condensed takeaways…
- First things first, this is diversification within a category of investments (stocks) so it’s not what a true diversified portfolio can and maybe should look like.
- Small-caps (Russell 2000) did better than their large-cap brethren (S&P 500) not only from the performance perspective but also from the perspective of delivering better risk-adjusted returns. That’s with comparing the 10 and 20-year rolling returns as well as the exact annualized performance over the last 20 years. Not what you would have expected considering the hype around S&P 500 this past many years but that’s expected considering how recency bias plays tricks on us. But then we got the data.
- International stocks sucked in this timeframe and that is and should be expected from any asset category from time to time. They say that you only know when you are truly diversified is when you always own one or two segments in a portfolio that are treading water at a given time. If everything does good or bad at the same time, you have a problem. That is to say that your portfolio should own a lot of uncorrelated investments though these days with correlation of literally everything with respect to everything else approaching one (perfectly correlated), it’s not that easy but that’s our world today.
- And when you sprinkle the ‘right’ type of investments in the ‘right’ proportion, though individually they might suck, the blended portfolio almost always overcomes that individual performance disadvantage over the very long-term. For the statistically inclined, that’s because when the variance of one investment is added to the variance of the other, the resulting combined variance of a portfolio is always lower. And hence that shows up in better portfolio outcomes, not only with what you make in returns over time but making those returns with a reduced portfolio volatility. So a win-win all around.
That’s all I have to say.
Thank you for reading.
Cover image credit – Chris F., Pexels