William Sharpe in 1966 devised a way to measure a risky investment’s performance compared to what a risk-free investment yields, adjusted for that risky investment’s risk (volatility). A mouthful, yes, but that relationship between risk and return is what came to be known as the Sharpe ratio, a widely used measure to quantify whether you are being rightly rewarded for the portfolio risks you bear.
This and the Capital Asset Pricing Model that Dr. Sharpe subsequently developed led to him winning the Nobel Prize in economics in 1990.
The Sharpe ratio…

In English, it is the excess return of a risky investment over and above the return that a safe investment yields per unit of risk (volatility) of that risky investment. This is another way of stating that what counts is not just returns but risk-adjusted returns.
The risk-free rate of course is not constant. Many use T-bills (Treasury bonds with a maturity of less than a year) as the benchmark for the risk-free rate but that’s not always right. Stocks as we know are long-duration assets (perpetuities in theory) so if you own an all-stock portfolio, you need to match that with a comparable duration asset like say a long-term bond with a 10-year or a 30-year maturity for instance.
And if you add shorter duration bonds to that all-stock portfolio, the duration of the risk-free asset and hence its return to calculate the Sharpe ratio needs to be adjusted accordingly to match duration for duration.
But in today’s never seen before interest rate world, the risk-free rate of return difference between long and short maturity bonds is not going to make or break things. In fact, you are free to ignore duration entirely and use a flat 1 percent rate of return in lieu for the risk-free rate.
So that was a bit of a technicality but what Sharpe ratio tells us is that you better get compensated for the risks you take in your portfolio. And the higher the Sharpe ratio for a portfolio, the better designed a portfolio you have. Within reasons.
Because you can play games using leverage etc. to prop up the Sharpe ratio of a portfolio but we know the thing with leverage. When things blow up, they blow up spectacularly.
But Sharpe ratio or anything to do with long-range portfolio construction and prediction does not work with individual stocks. Or individual bonds. Or a single piece of real-estate. Or your entire angel investment portfolio.
It only works with broad-based asset classes that you can derive meaningful statistics from to build a portfolio around which then forms the core part of your financial plan (more on that later).
So someone just starting out in his career could have owned an all-stock portfolio that is globally allocated, across size and value factors. Of course an all-stock portfolio means being exposed to the full brunt of the volatility of stocks but that’s expected.
And this is what you would have had to endure over the years. We are going to run through three different portfolios with this one being the one with a lower Sharpe ratio than the other two. A lower Sharpe ratio isn’t necessarily bad but if you are comparing two likewise portfolios, you’d want to the pick one with a higher Sharpe ratio as long as you understand what’s in that portfolio.

The exact mix of this all-stock portfolio is irrelevant because you can always implement your own tweaks based on which corner of the market you think offers a better value but this is what you should expect. Or at least this is what you did get going back in time.
Now these are rolling returns which means that say for the 3-year bar in the plot above, you’ll start out in 1987 and end in 1990, then move to 1988 and end in 1991, then to 1989 and end in 1992 and so on. That way, you are not picking and choosing timeframes.
So what stands out is there was a year when this portfolio declined in value by 41 percent but then there was also a year where the portfolio gained an equivalent amount. But there was never a 5-year period where this portfolio lost you money. So that’s the perk of remaining invested for the long-term.
And depending upon how lucky or unlucky you were, the difference in returns between different 20-year periods is huge. I mean there was a 20-year band in the same 1987-2020 time-period where you did almost 12x your money (+1072 percent) in one versus just 4x your money (+323 percent) in the other.
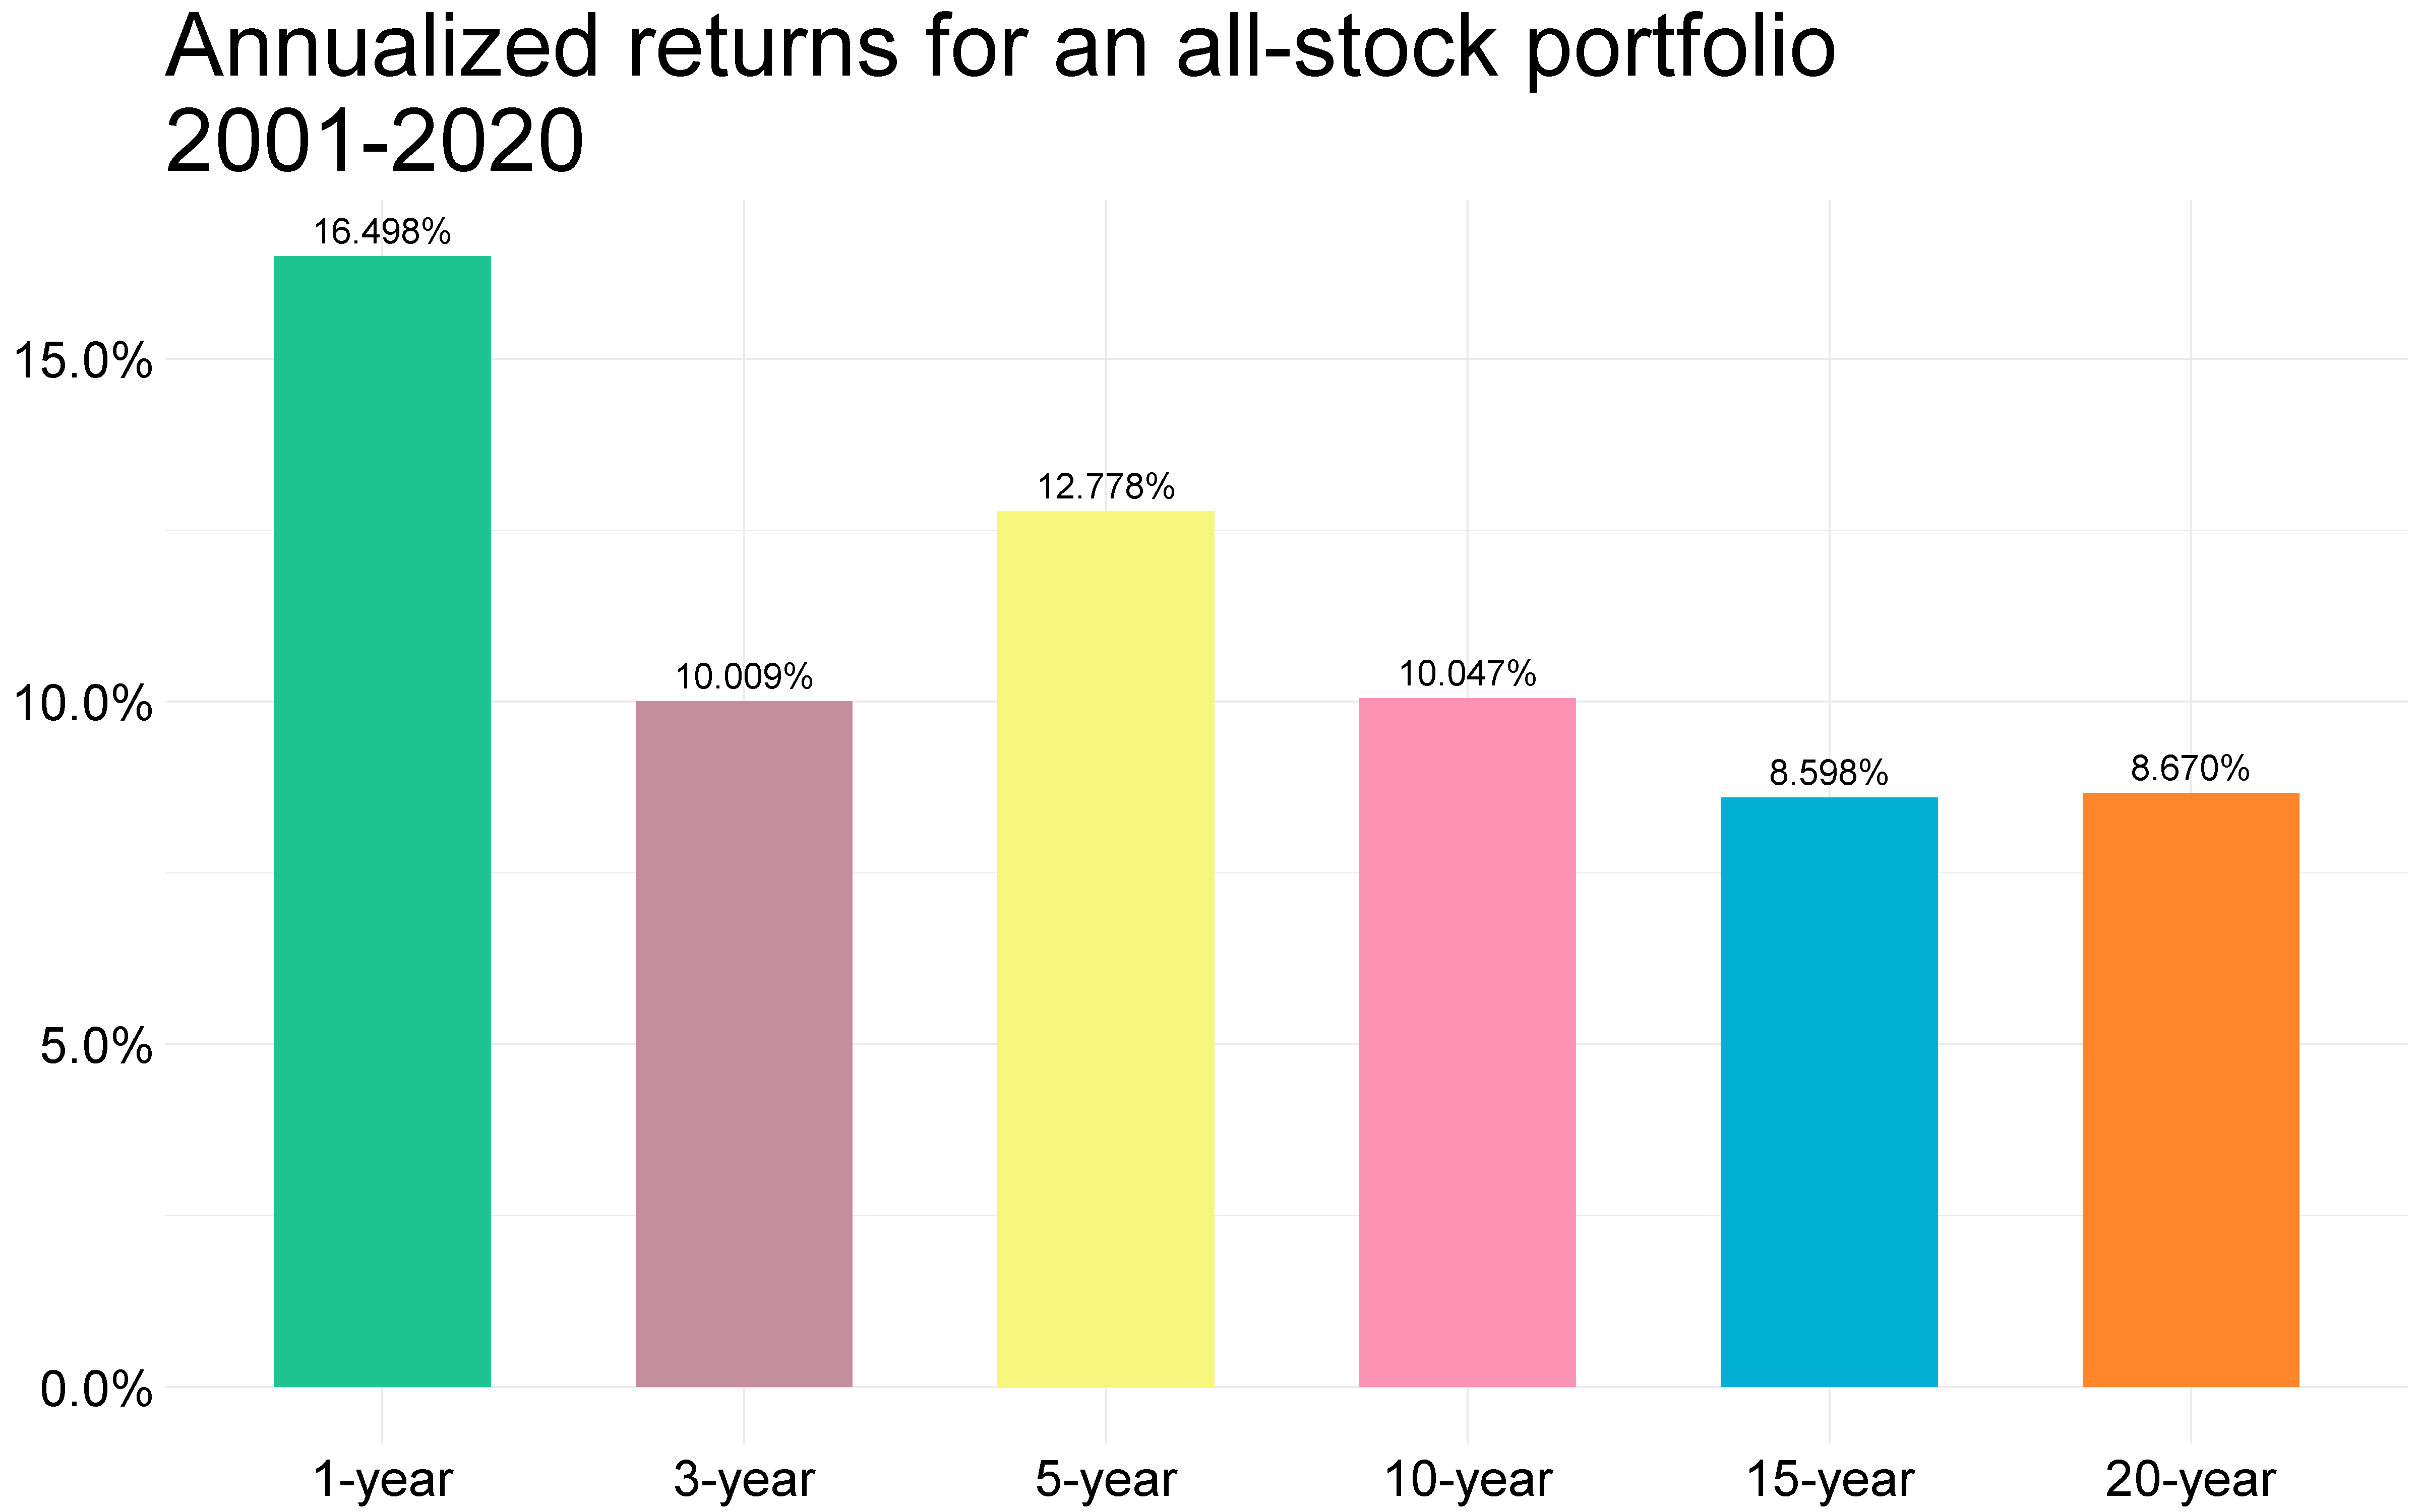
And that worst 20-year band most likely corresponds to the last 20 years that ended in 2020 as can be seen with the exact annualized returns that you were able to achieve with this all-stock portfolio.

But this 20-year band saw a lot. Starting out of the gate was the Dot-com crash followed by the housing market crash of 2008 and then of course the pandemic. Not saying that the next 20 years can’t be worse but just saying.
So if you endured through this, you should be able to endure through anything the market throws at you except for world-ending calamity. But then, your portfolio would be the least of your worries and hence.
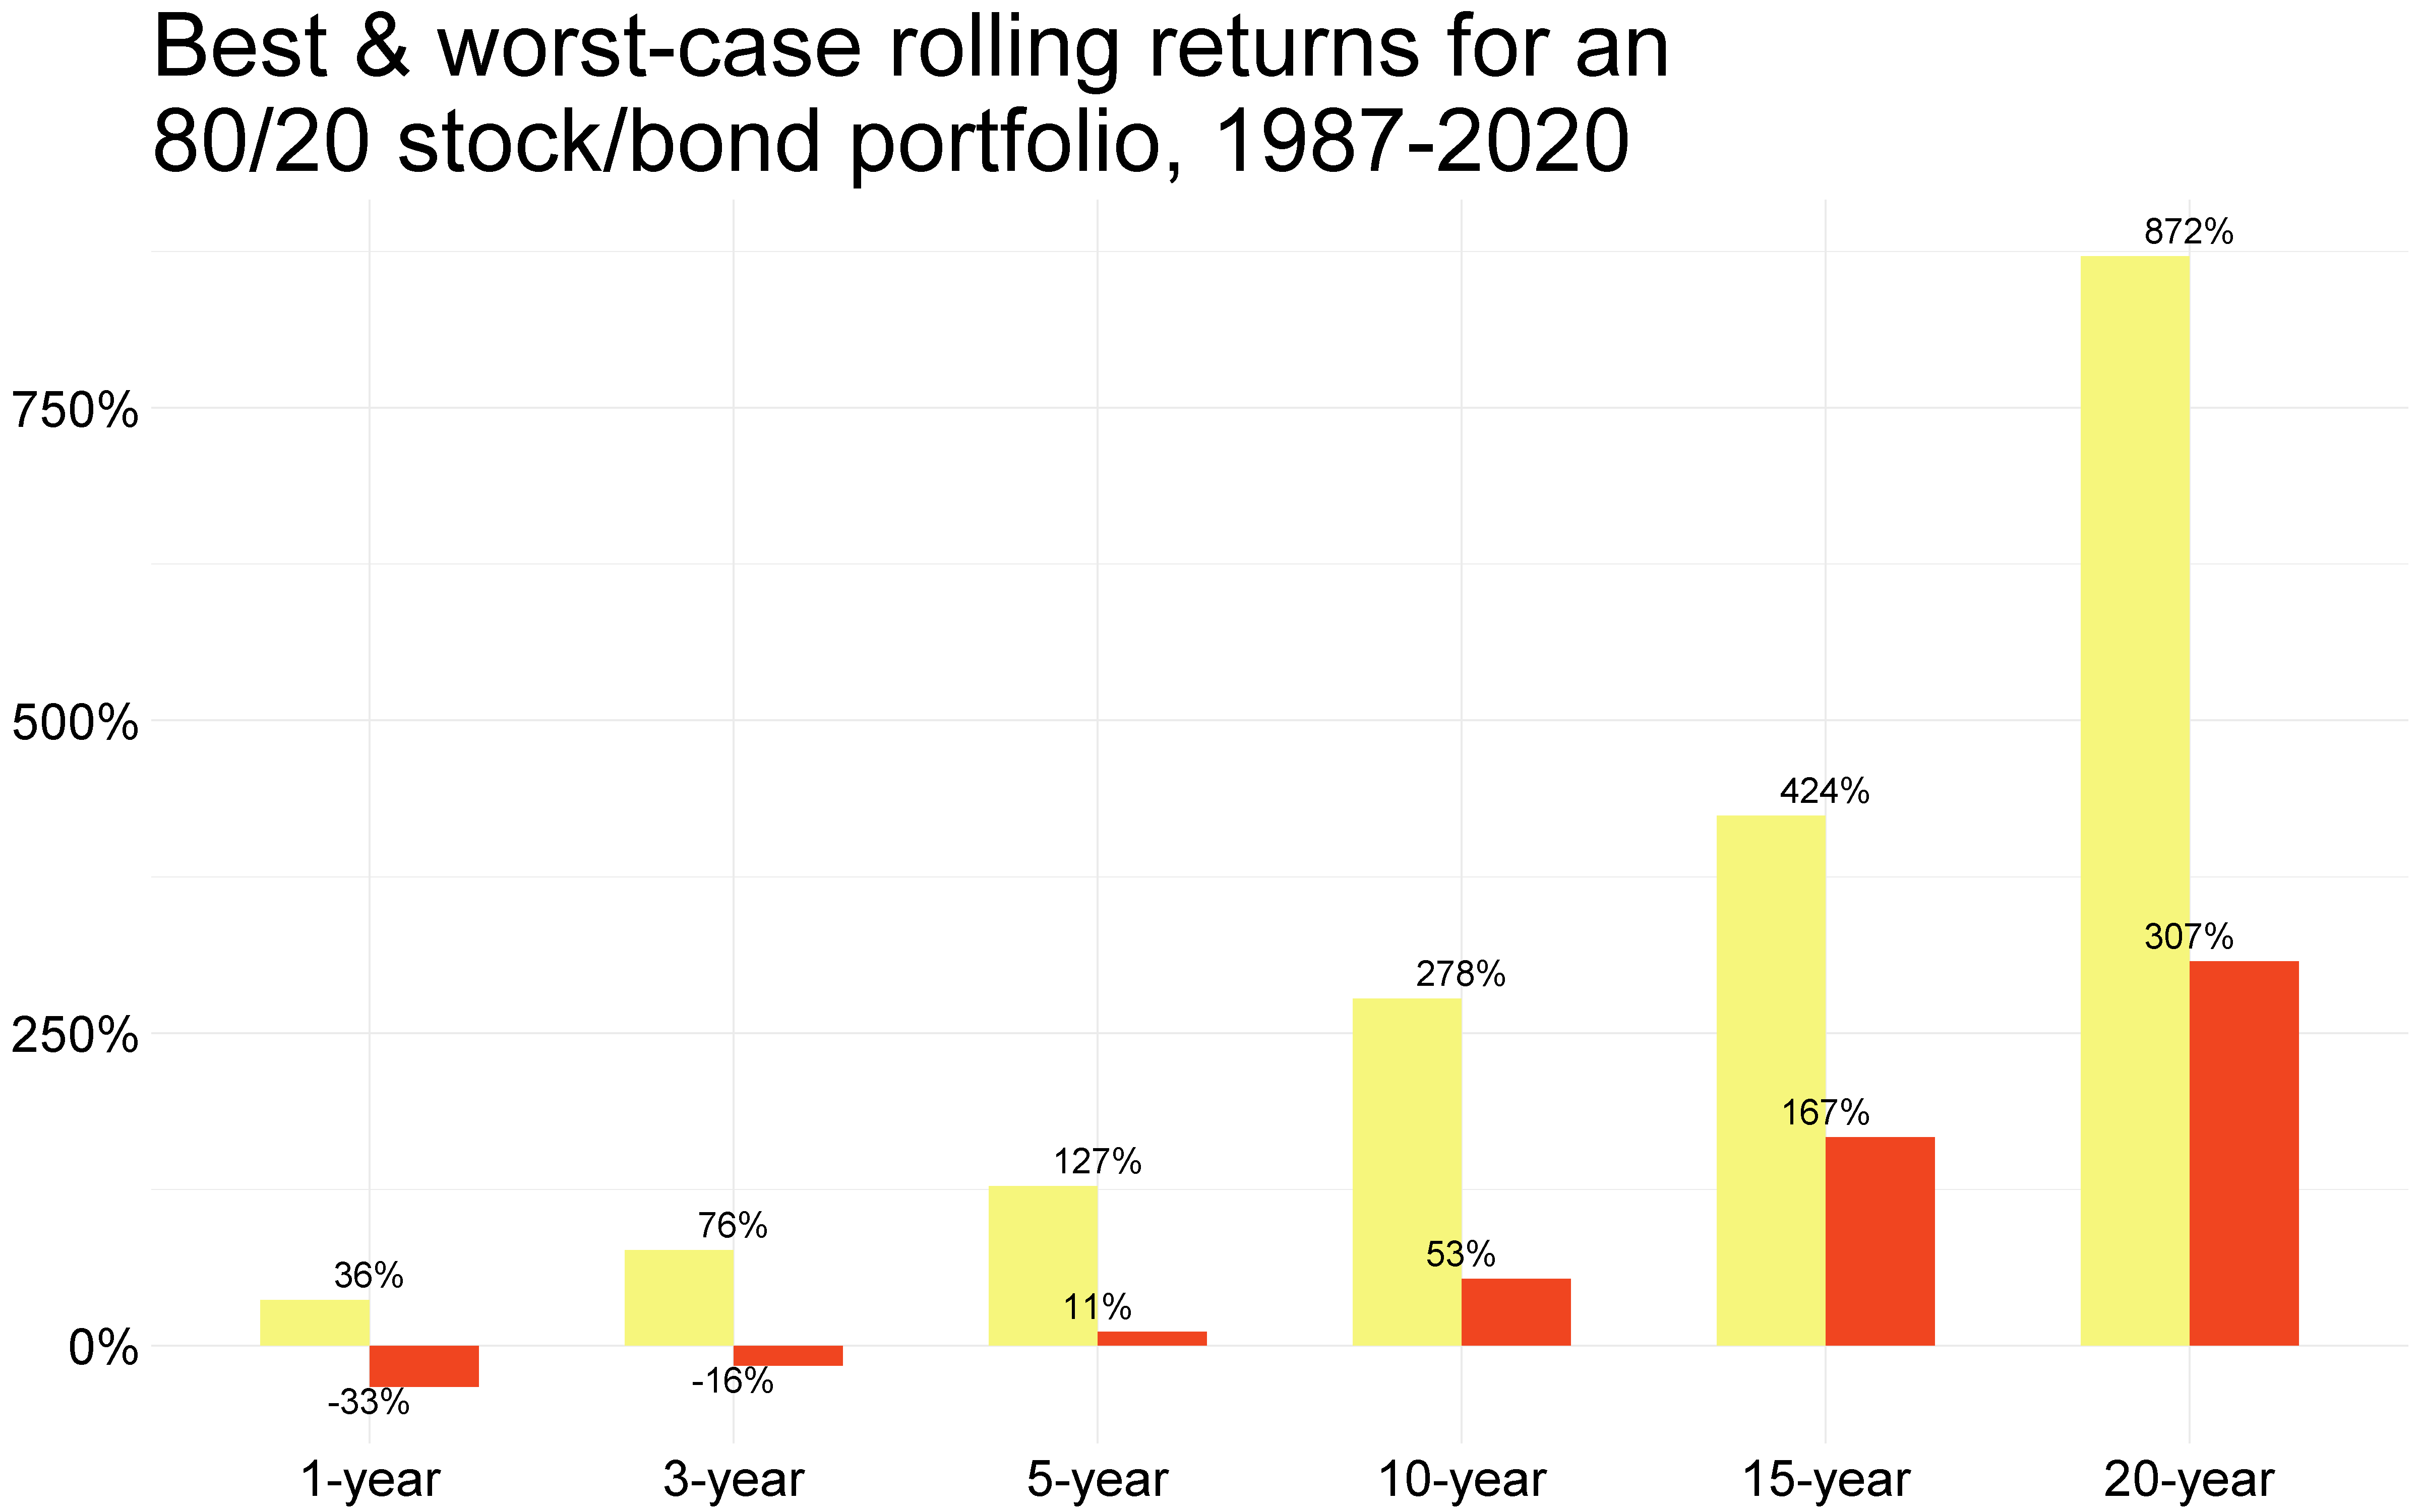
Now someone mid-career who had amassed a reasonable amount of money towards retirement could start to temper down on the volatility by allocating say 20 percent towards bonds. Bonds are less volatile and don’t generally yield more than stocks but the lower volatility of bonds and their inclusion in a portfolio shows up in the increase in Sharpe ratio of that portfolio. Again, not necessarily good or bad but a metric you can use to compare across similarly constructed portfolios.
And the best and worst-case returns below.

The annualized returns for the same portfolio going back in time.

Not that much different from an all-stock portfolio but that was for the last 20-years where stocks were literally cut in half twice in one decade.
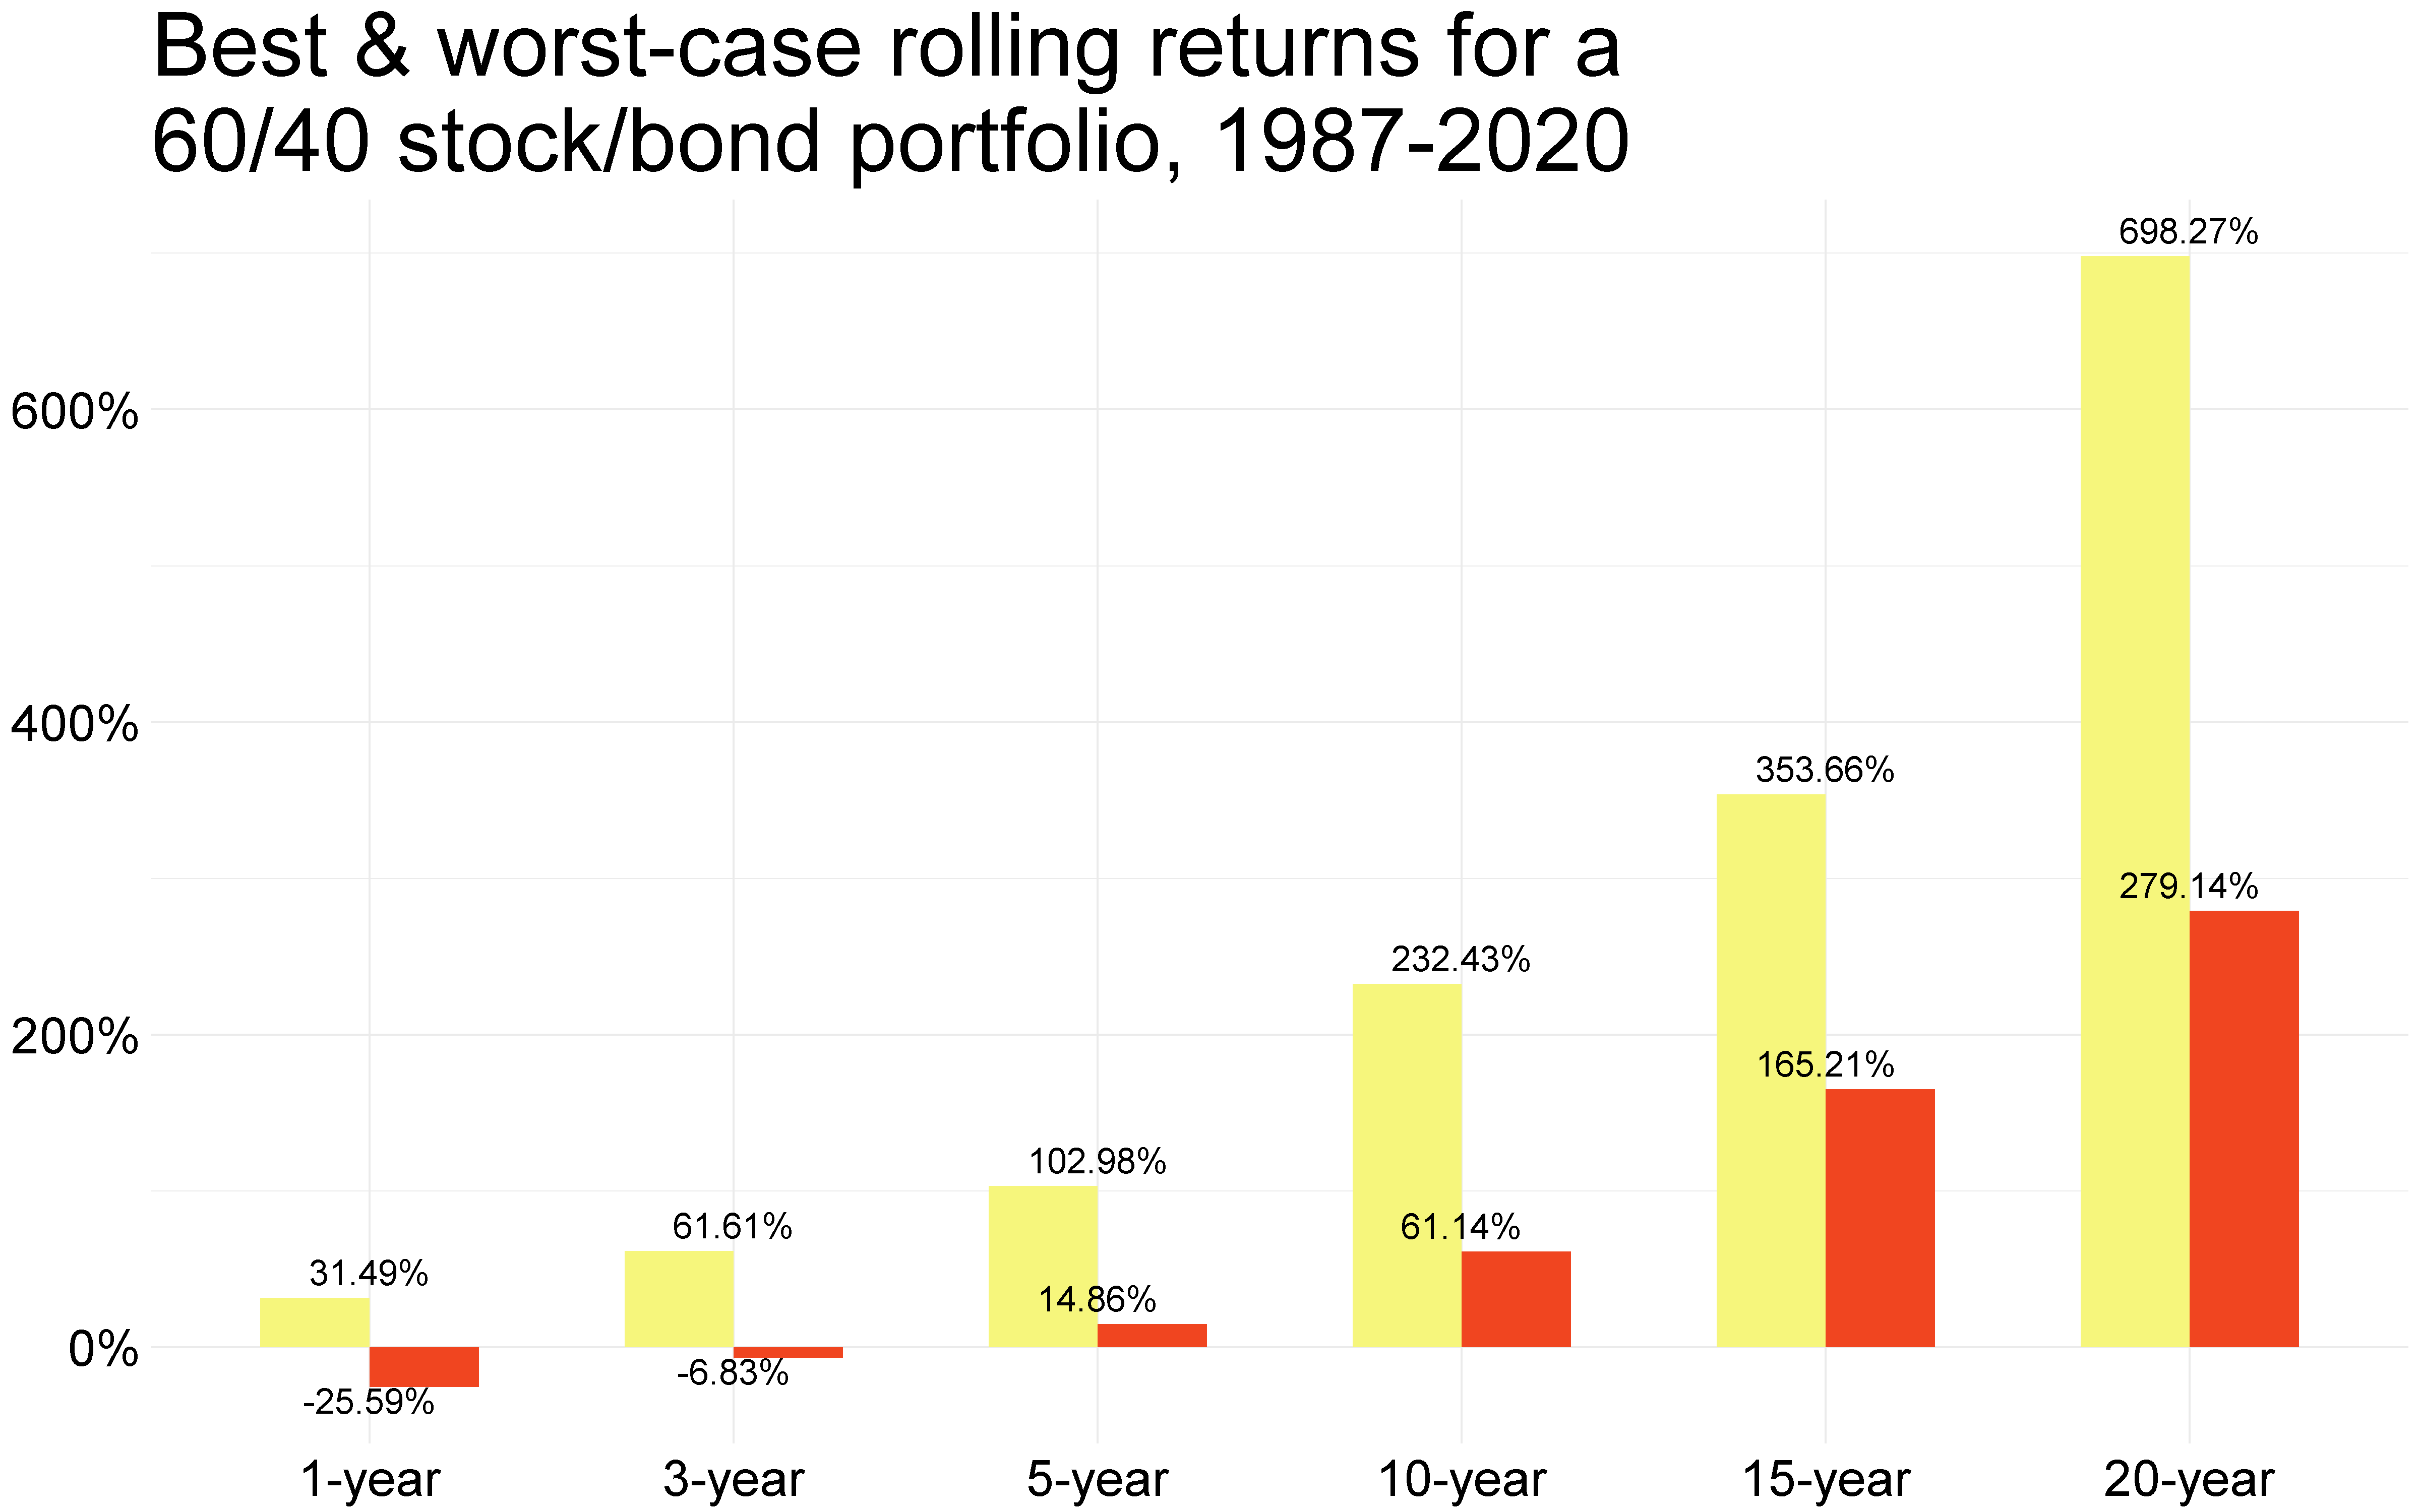
Now someone nearing retirement could have increased the allocation to bonds to say 40 percent. The Sharpe ratio for this portfolio as expected goes up so if you are comparing two portfolios with a similar stock/bond mix, you’d know which one’s more efficient.
And the best and worst case performance data below…

…as well as what this portfolio did going back 20 years.

Again, the anomaly with the last 20 years shows up with stocks not doing as well as they did historically and with bonds absolutely crushing it. This is unlikely to be repeated for a portfolio with 40 percent allocation to bonds over the next 20 years though.
So what kind of portfolio should you own? But before that, a bit on what I do with my (our family’s) money.
We use a core and explore approach to how we deploy our savings. The core is the can’t miss, can’t fail segment of our money that must be there when we need it and hence is invested accordingly. That makes up about 90 percent of all the money we have though that percent allocation is higher now for reasons I’ll elaborate on more below. And it’s invested in an all-stock portfolio like the one shown above for three reasons:
- 4 percent is what is typically used as a safe withdrawal rate from a portfolio to live on during retirement though that might need some adjustments considering the interest rate environment we find ourselves in. But a 4 percent withdrawal rate means your portfolio cannot afford a lot of volatility and hence bonds become an important component of that portfolio. But if say a 2 percent withdrawal rate is plenty to live on during retirement then there’s no need to add bonds as dividend income alone can fulfil your income needs and that is where we expect to find ourselves at.
- There is unlikely to be a repeat of bond market performance of the last 40 years over the next 40. So if you don’t need bonds, you should not need bonds. Yes, the right kind of bonds can and do make the ride smoother but if you don’t care about the ups and downs, you don’t need bonds either.
- And though an all-stock portfolio will have an inferior Sharpe ratio than a portfolio with a decent allocation to bonds, that in and off itself is not necessarily bad. Because there is no guarantee that adding bonds will enhance the volatility reduction benefits bonds provided in the past. So though Sharpe ratios are important to compare two similar portfolios, that is where that comparison stops. Just because a portfolio’s Sharpe ratio is lower does not automatically imply inferiority.
I also do a bit of exploring with our money and that’s where the tiny explore portion of our money is invested. We haven’t done much to this in the last many years due to the valuation environment we find ourselves in but we will at some point again when wonderful businesses could be had at reasonable valuations when this current cycle turns. And turn it will.
But of course there is no need to do the explore if you are not meeting your plan goals. And it also comes down to whether you enjoy doing all the work needed to explore because work it does take.
Plus since statistical calculations can’t be done with the explore segment of my portfolio, Sharpe ratios and things like that goes out the window. This is an attempt to eke out a bit more than what the core-only portfolio can deliver but of course there are no guarantees.
The explore portion of our money is currently invested in a bunch of businesses that are small, cash flow rich with predictable business models. At least, businesses that I can do some modeling and projections on. Businesses like Raven Industries that make precision agriculture products and engineered films. It’s been in the news lately as it is getting acquired in an all cash deal.
Other companies that were acquired since the time I first built this portfolio almost a decade back…
- Pall Corp., a maker of water filtration systems was acquired by Danaher Corp. August 28, 2015 was the last trading day for the stock.
- Mead Johnson Nutrition Co., maker of infant formula such as Enfamil brand, was acquired by Reckitt Benckiser Group. June 14, 2017 was the last trading day for the stock.
- Clarcor, a maker of filters for automotive and heavy industrial applications was acquired by Parker-Hannifin. February 27, 2017 was the last trading day for the stock.
- Kaydon Corp., a maker of industrial bearings and shock absorber systems was acquired by SKF. October 15, 2013 was the last trading day for the stock.
- Bio-Reference Labs, a provider of clinical laboratory testing services for the detection, diagnosis, evaluation, monitoring, and treatment of diseases in the United States was acquired by Opko Health. August 19, 2015 was the last trading day for the stock.
- Sigma-Aldrich, a company that develops, manufactures, purchases and distributes a range of biochemical and organic chemical products, kits and services that are used in scientific research was acquired by Merck. November 17, 2015 was the last trading day for the stock.
Then there are business like International Flavors and Fragrances. And W.W. Grainger. And Copart. And C.H. Robinson Worldwide and a few others that we’ll continue to own for a long time.
Hope this helps.
Thank you for reading.
Cover image credit – RF Studio, Pexels

